Jan 11 – Top Economic Events & Trade Setups Today
Good morning, traders. The markets were totally fun as these remained highly volatile after China hinted about trimming its US treasury holdings, along with NAFTA issue which placed a bigger impact on the Loonie. Today the economic events from the US and Eurozone will stay in focus…
Today’s Top Economic Events
Eurozone- EUR
ECB Monetary Policy Meeting Accounts – The European central bank will be releasing the accounts of monetary policy meeting minute at 12:30 (GMT) today. It’s a detailed record of the ECB Governing Board’s most recent meeting, providing in-depth insights into the economic conditions that influenced their decision on where to set interest rates.
Considering the recent shift in the tones of global central bankers, we should stay attentive to see any surprisingly hawkish addition in the meeting minutes.
US Dollar – USD
PPI m/m – The Bureau of Labor Statistics will release the producer price index at 13:30(GMT). It’s a leading indicator of consumer inflation. When producers charge more for goods and services the higher costs are usually passed on to the consumer. The figure is expected to grow by 0.2% vs. 0.4% in Dec.
Core PPI m/m – It’s expected to be 0.2% vs. 0.3% in the past, whereas, the higher figure will support the US dollar.
Unemployment Claims – You should monitor the jobless claims at 13:30 (GMT), although these aren’t expected to surprise the market.
Today’s Top Trade Setups
EUR/USD – Weaker Dollar Driving The Pair Bullish
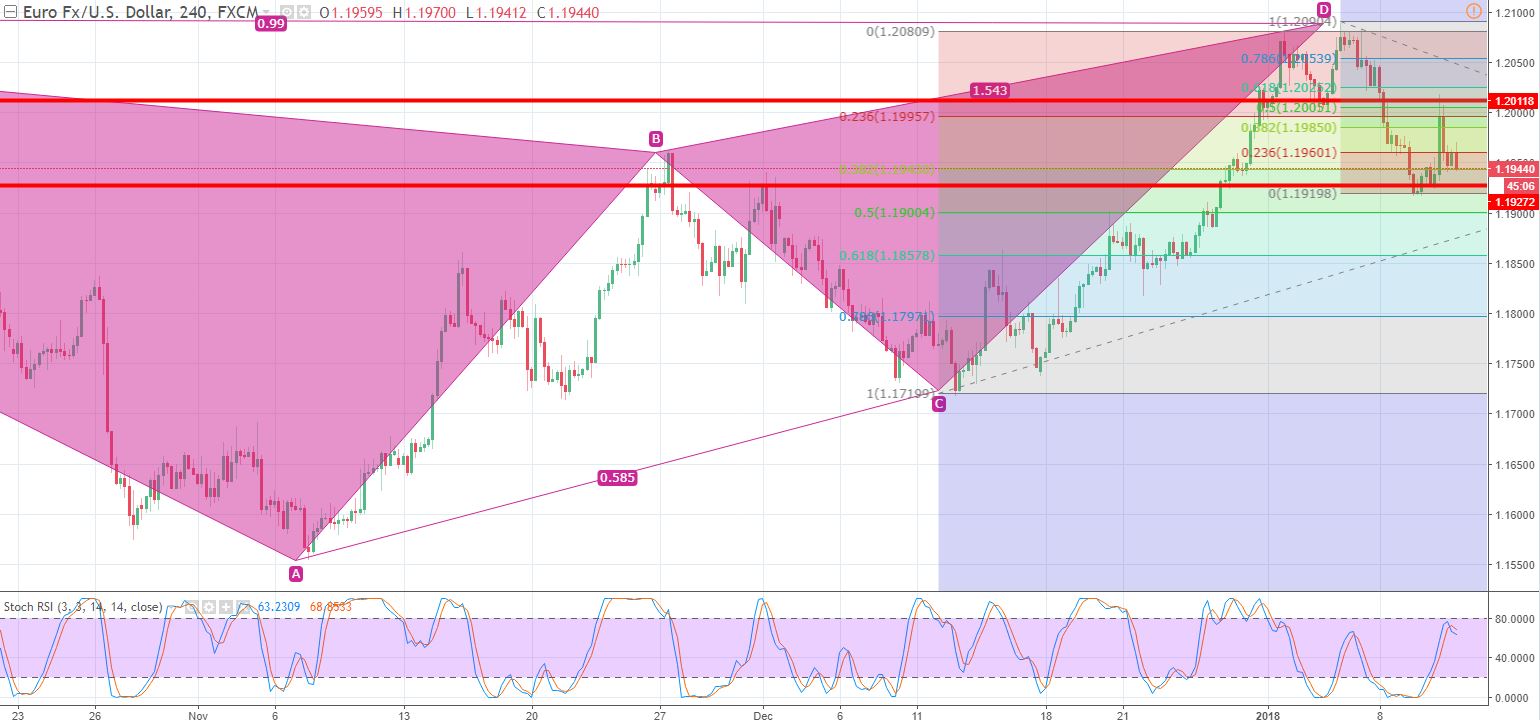
Yesterday, the traders took profits on the dollar after a series of news from China, Japan, and Canada. The direct currency pair was trading on the bullish bias which was extended by the technical side of the market.
EUR/USD – 240 – Min Chart
Looking at the chart, the pair already completed 50% Fibonacci retracement at $1.2005 and now it’s heading back to trade in a bearish mode.
EUR/USD – Key Trading Levels
Support Resistance
1.1907 1.2002
1.1868 1.2058
1.1812 1.2097
Key Trading Level: 1.1963
EUR/USD Trade Plan
It will be nice to stay bearish below $1.1965 with a stop above $1.1985 and a take profit of $1.1925 and $1.1895.
USD/JPY – Bearish Dragon Weighting The Pair
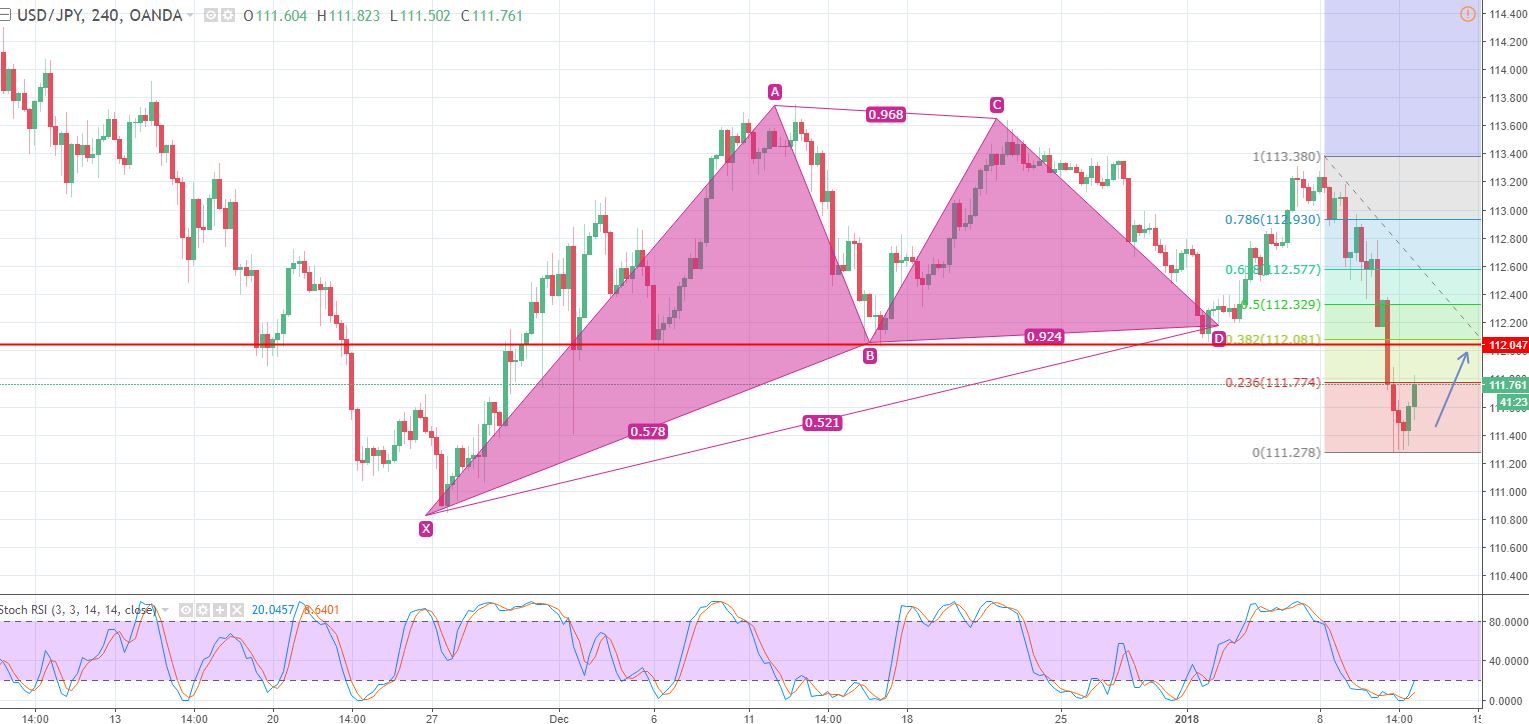
A day before in our USD/JPY forecast, we discussed the triple bottom pattern at $112.120 which was one of the good buying zones, but the safe haven currency violated the level as the latest fundamentals kept on playing with investors sentiments.
USDJPY – 240 – Min Chart
For now, the pair has formed a bearish dragon which is signaling the power of selling bias. But now, we need to wait for a slight pullback in the oversold pair. The USD/JPY can soar up to 112.08 and 112.350 before giving further sell opportunities.
USDJPY – Key Trading Levels
Support Resistance
110.86 112.38
110.3 113.34
109.34 113.9
Key Trading Level: 111.82
USD/JPY Trade Plan
Considering the technicals, I will be monitoring $111.850 to stay bullish above it with a target of $112.350. Below this ($111.850), the pair can continue selling trend. Good luck traders and stay tuned for more exciting trade ideas.


