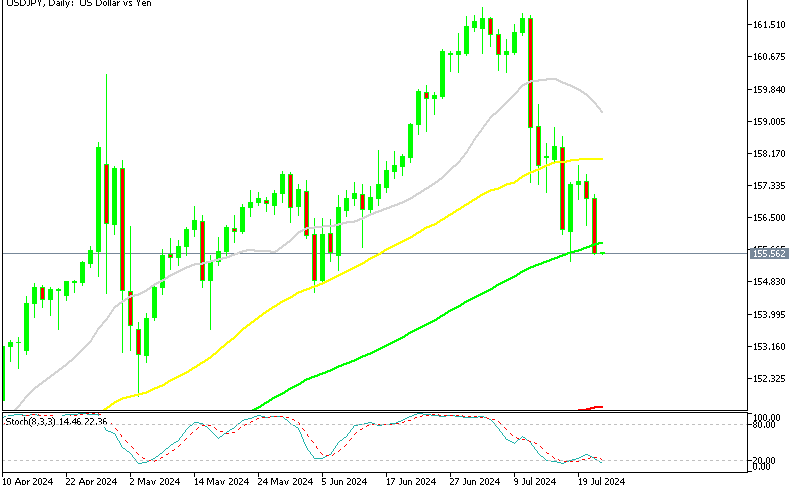
USD/JPY Produces 30 Pips-Today’s Technicals
The USD/JPY is showing signs of trend exhaustion. Heavy bearish action has defined the last week of trading. Now that price has approached a long-term support level, buyers are entering the market in force. Heavy participation seems to be the order of the day, with downside support proving formidable.
USD/JPY Technicals
In a Thursday market update, I outlined a trading plan for the USD/JPY. This recommendation performed beautifully, producing a 32 pip profit.
++8_15_2017+-+1_12_2018.jpg)
Long-term Fibonacci retracement levels are a strong technical tool to have in your arsenal. However, deciding where and how to apply the retracements can be a challenge. Many traders adhere to an Elliott Wave methodology when applying Fibonacci retracements. If you are new to Fibonacci’s, then this is a good place to start.
Here are a few areas of support and resistance for the remainder of the session:
- Resistance(1): 38% of Current Bear Run, 111.89 (not pictured)
- Support(1): 50% Sept. Low/Nov. High, 111.02
- Support(2): 62% Sept. Low/Nov. High, 110.14
Overview: For now, our downside support level of 111.02 is holding strong. This area has been tested several times now, each rejecting 111.00 vigorously. The proximity of a macro Fibonacci retracement level and a big round number has produced a profitable long entry.
The USD/JPY is poised to give us another trade in the coming sessions. A retracement sell, or buy from Support(2) are opportune areas to enter this market. Stay tuned for details on how to benefit from the action in coming days.


