Choppy Session In The Gold – Is it a good time to short?
It's been two days now, the Gold is stuck near the multi-months high after the dollar slipped...

It’s been two days now, the Gold is stuck near the multi-months high after the dollar slipped against a basket of currencies. The bullion market wasn’t that active due to US bank holiday but the investors are back today. However, we already closed a trading signal on DAX, pocketing nice profits. Check our another trade on Gold…
GOLD / XAUUSD – Technical View
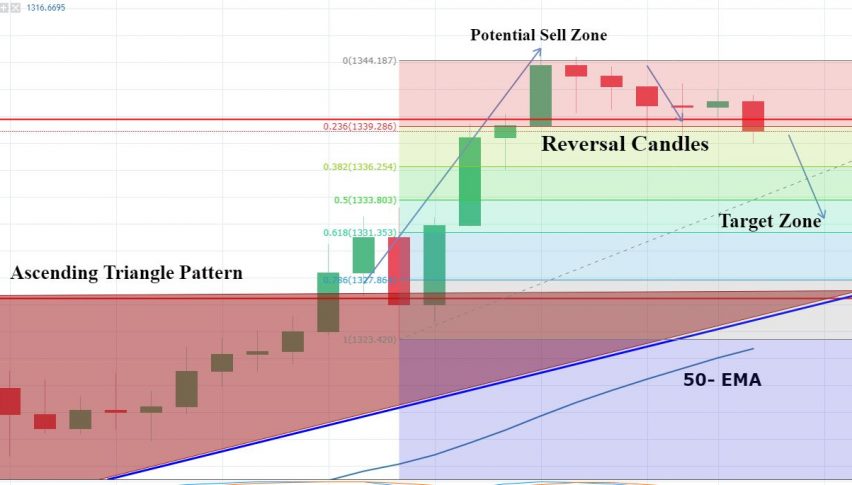
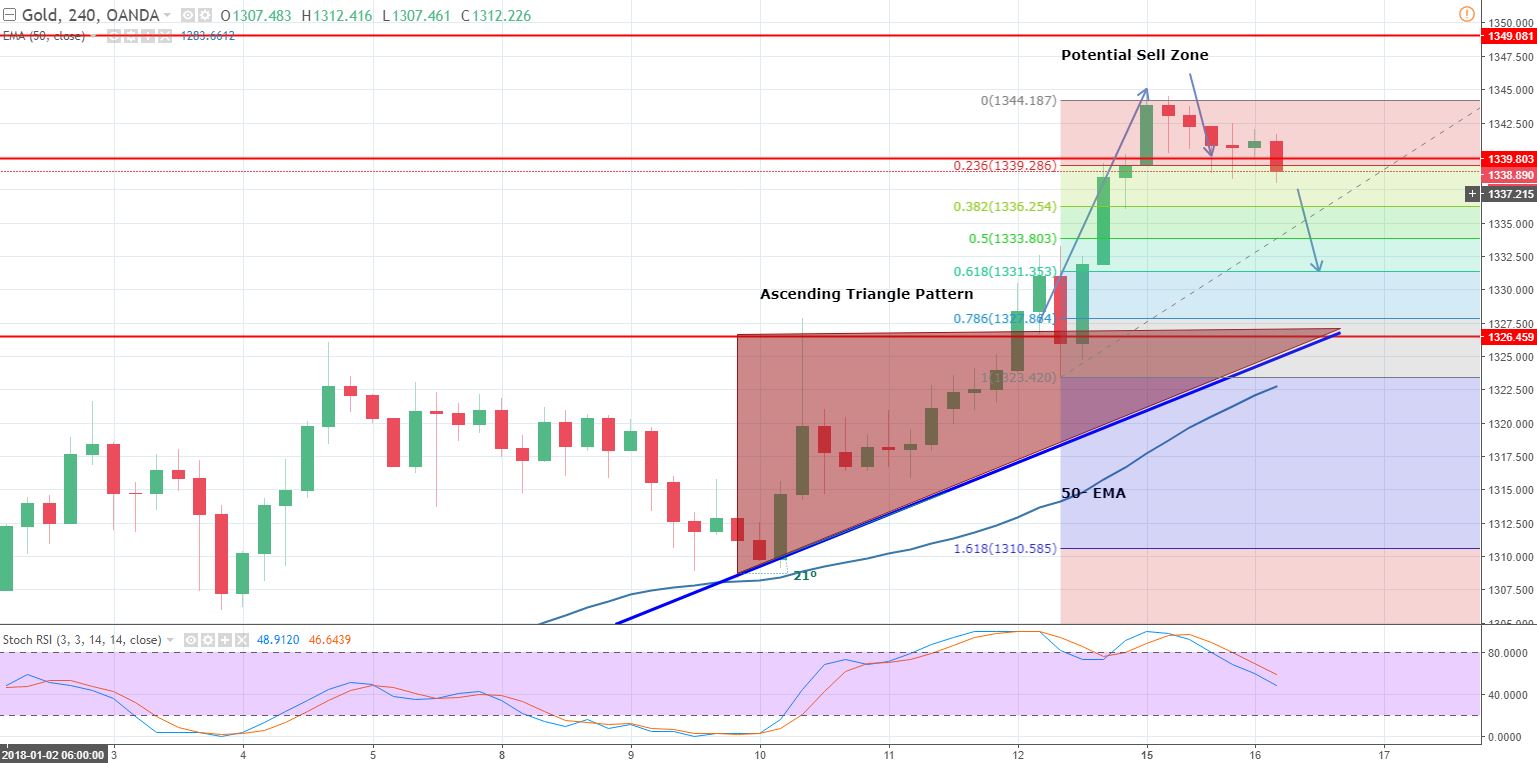
The technical side of the Gold hasn’t changed much. A couple of days ago, Gold broke out of the ascending triangle pattern at $1,326 and lead the metal to a multi-month high of $1,344. While this movement, the precious metal entered the overbought zone.
Gold – 240 – Min Chart
The Gold has formed a candlesticks pattern called “hanging man” followed by the strong bullish candles. It signifies a potential of a bearish reversal. The lagging indicator, 50- periods EMA is also supporting the bearish bias.
You can see on the 4- hour chart below, the 50- EMA, which is used to forecast the future behavior of prices in the time series analysis, is holding at $1,322. So, technically the Gold prices should be around $1,322. But wait, having divergence between lagging indicators and CMP isn’t something surprising. So, we should aim for $1,335 and $1,331 today.
Gold // XAUUSD – Trading Plan
The idea is to stay bearish below $1,340 with a stop above $1,344 and take profit at $1,335 and $1,331. Good luck.
- Check out our free forex signals
- Follow the top economic events on FX Leaders economic calendar
- Trade better, discover more Forex Trading Strategies
- Open a FREE Trading Account


