1.22, Once Support Now Resistance for EUR/USD
Last week, EUR/USD had been trading in a strong uptrend that has continued into this week. The uptrend, however, has become weaker.
Last week, EUR/USD had been trading in a strong uptrend that has continued into this week. The uptrend, however, has become weaker, and it seems that a retrace lower is soon to follow.
Buyers pushed above 1.23 yesterday morning, and attempted once more in the afternoon. That being said, USD got back on its feet, and by the evening this forex pair had dived below 1.22.
The support area has now turned into resistance
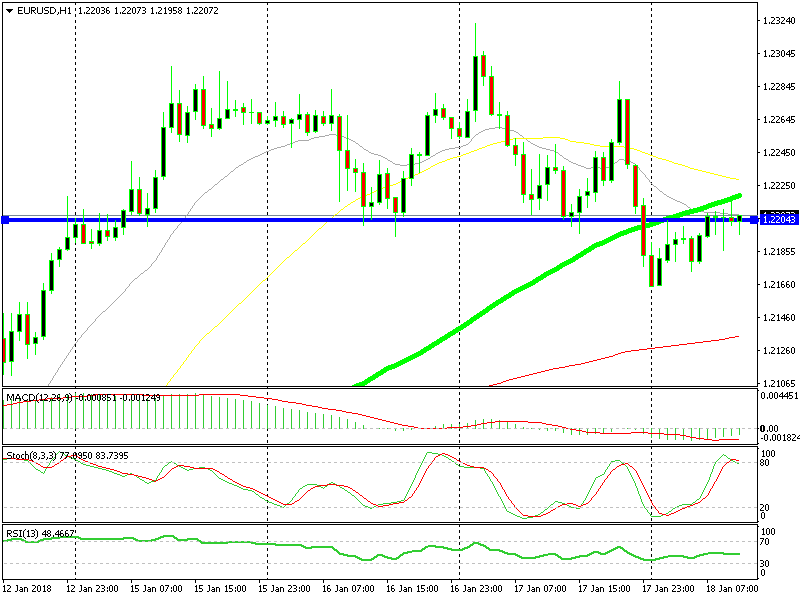
As you can see from the chart above, all of this week, this level was support, and now that it has finally been broken, it seems that it has become resistance. Support and resistance levels come with a 20 buffer area around them, and we cans see that the price has moved above and below it. It is still valid until it reaches a sustainable break.
We can see a number of moving averages around the 1.22 area (aside from the 1.22 level itself,). Most notably the 100 SMA (green), and the 50 SMA (yellow), which currently stand at 1.2220. It looks as though these two moving averages will now provide resistance.
The stochastic indicator is oversold on the H1 chart. That’s telling us that the retrace up has run its course, and we can now expect a move down. The USD is fighting back for reasons that will be explained in the next update. A decent move down is likely now that the uptrend has been dented.
- Check out our free forex signals
- Follow the top economic events on FX Leaders economic calendar
- Trade better, discover more Forex Trading Strategies
- Open a FREE Trading Account


