Choppy Bitcoin (BTC) Braces for a Pullback
So far, it's been a good of the week. Our forex trading signal on DAX, the German index, made more than 50 pips and the Crude Oil signal...

What’s up, Crypto traders. So far, it’s been a good of the week. Our forex trading signal on DAX, the German index, made more than 50 pips and the Crude Oil signal is also floating in profit. However, today the volatility isn’t only limited to the forex market, Cryptos are also on a move. If you are in the trade or looking to trade Bitcoin, here’s something for you…
BTC/USD – Technical View
Fellow, Bitcoin is consolidating in a sideways range of $10,550 – $11,650, like there’s no way out. It’s mostly because of the news regarding hacks, gunpoint thefts and the ever-changing shift in the regulatory aspect, which has eventually caused money being pulled from the table.
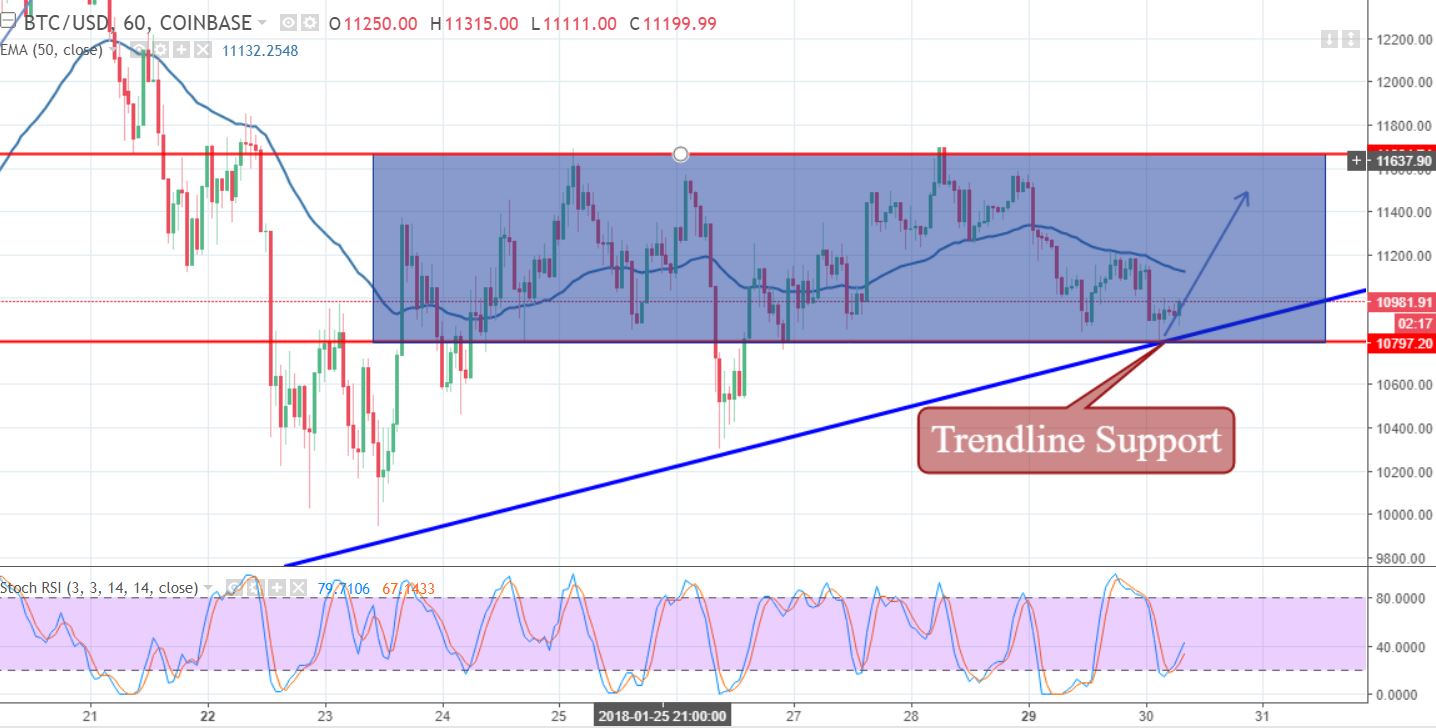
BTC/USD – Hourly Chart
For now, you can see a bullish trendline on the hourly chart which is supporting the BTC/USD at $10,850. Zooming out on the hourly chart, it looks like Bitcoin is forming an ascending triangle pattern. For your information, typically these sort of patterns leads to a bullish breakout. It means BTC is going to soar? It all depends upon the closing of today’s candle. For instance, closing below $10,550 is very likely to make Bitcoin weaker. Likewise, a daily close above $10,550 can give us a pullback.
Support Resistance
10856 11590
10568.2 12036.2
10122.1 12324
Key Trading Level: 11,302.2
- Check out our free forex signals
- Follow the top economic events on FX Leaders economic calendar
- Trade better, discover more Forex Trading Strategies
- Open a FREE Trading Account
- Read our latest reviews on: Avatrade, Exness, HFM and XM
Related Articles


Sidebar rates
Related Posts
