Getting Ready to Sell EUR/GBP
EUR/GBP has traded above 0.88 over the last several months. There has been the occasional break to the downside once in a while, but ...
The Hourly Chart
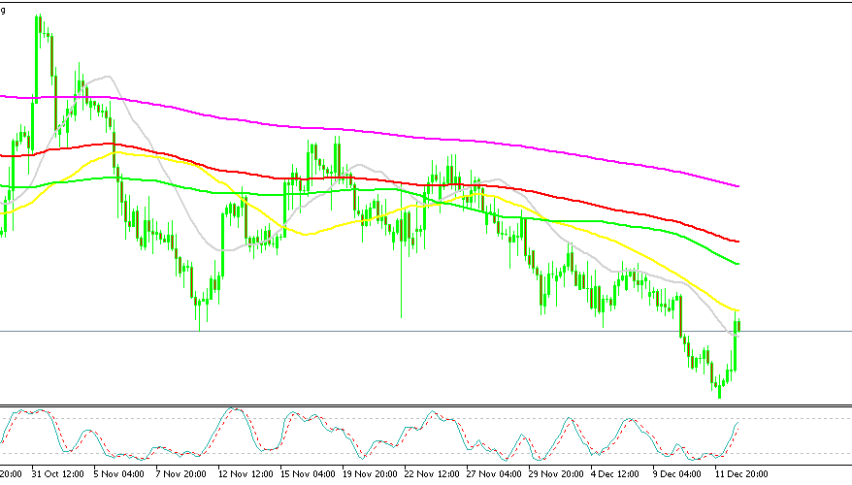
EUR/GBP has traded above 0.88 over the last several months. There has been the occasional break to the downside once in a while, but the price has returned back up. The main indicator that has kept the buyers in charge has been the 100 smooth moving average on the daily chart.
That moving average, however, broke on Monday of last week, as the GBP gained considerable pace on comments about a soft Brexit. Since then, this Forex pair has been on a steady bearish trend.
EUR/GBP has retraced higher over the last two days. We are now approaching the 100 SMA once again on the daily chart, and it’s looking like a great opportunity to open a sell trade on this pair.
The moving average on the daily chart currently stands at 0.8808. The 0.88 level should be a big resistance level in itself, as it was support until this pair moved lower.
The 200 SMA looms above
The H1 Chart
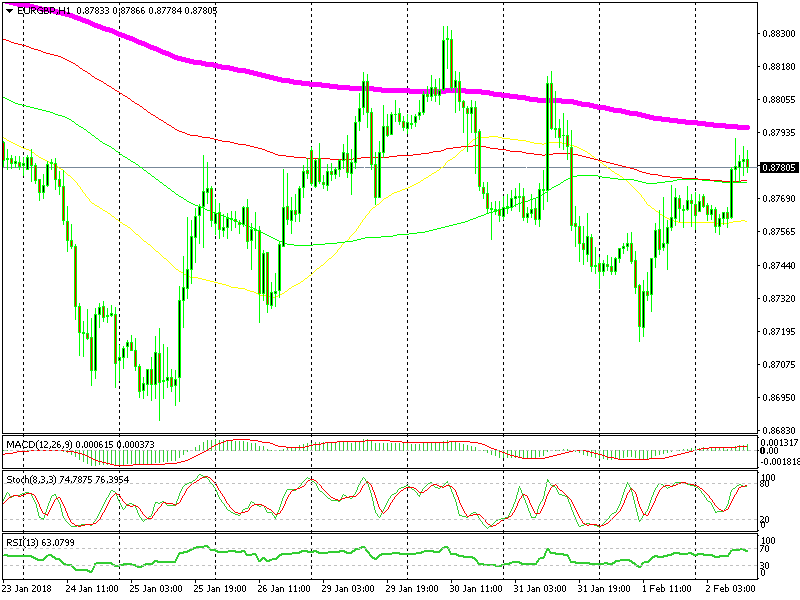
Looking at the H1 chart, we can find another moving average around the 0.88 level. The 200 SMA (purple) stands up there, and is likely to add extra strength to this area. It has done so before, despite being pierced briefly a few times.
The stochastic indicator is already overbought
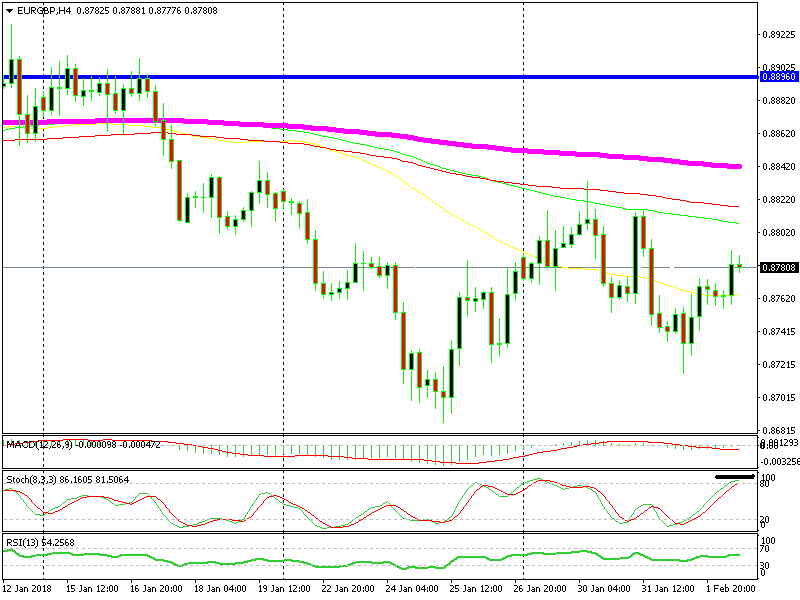
If you switch to the H4 chart, you can see that the stochastic indicator has reached overbought level, meaning that the retrace has almost concluded. Based on these three timerfame charts, I believe that a sell trade makes sense around these levels. I will, however, wait a bit longer to see if we can get a better price higher up, probably at 0.88.
- Check out our free forex signals
- Follow the top economic events on FX Leaders economic calendar
- Trade better, discover more Forex Trading Strategies
- Open a FREE Trading Account