EUR/GBP Forms a Bearish Pattern at Resistance on the Daily Chart
EUR/GBP has been trading on an uptrend in the last several weeks. It has been moving higher since the end of January with a couple of...
EUR/GBP has been trading on an uptrend in the last several weeks. It has been moving higher since the end of January with a couple of pullbacks lower during this time. But now, it has reached a resistance level. That resistance level comes at around 0.8920 and it has been the high so far this year.
The daily chart is obviously overbought, since the stochastic indicator is overbought. That is one sign that the uptrend might have reached a limit. Now, the reverse is supposed to follow and it looks like it is already happening.
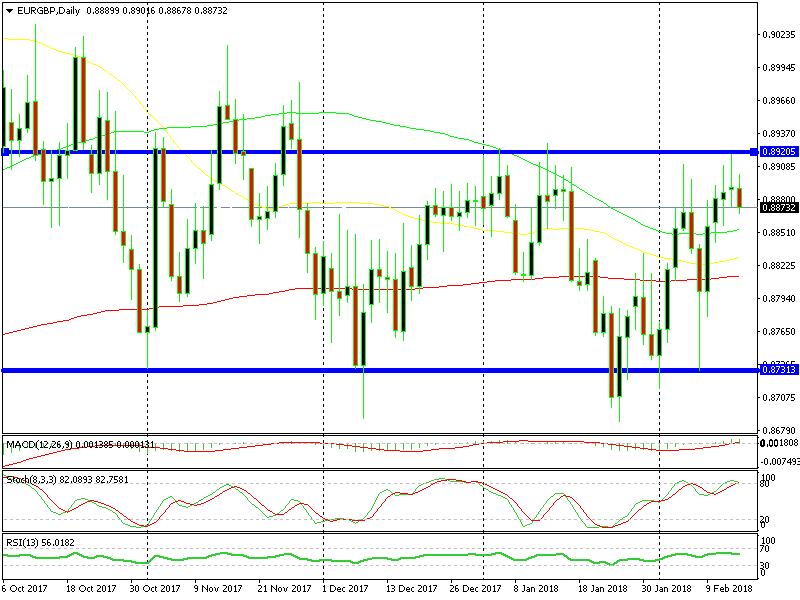
Yesterday’s daily candlestick is bearish
The 100 SMA (green) used to provide resistance in January, but that moving average has moved lower, so we can’t count on it now. We just have to look how the price behaves at the 0.8920 resistance level and we see that it is finding it hard to break above.
Another bearish indicator is yesterday’s daily candlestick. The candlestick closed as a doji yesterday. The doji is a reversing signal after a trend and as we said, he reverse is taking place.
I wish I had seen this chart yesterday or earlier today, so I could open a sell signal near the top. Although, we are not too far from the top. I will wait for a pullback higher though and try to open a long term sell forex signal. The risk/reward ratio is pretty good so we are following this trade.
- Check out our free forex signals
- Follow the top economic events on FX Leaders economic calendar
- Trade better, discover more Forex Trading Strategies
- Open a FREE Trading Account