NZD/USD Playing Games between Support and Moving Average
We opened a third signal in NZD/USD last Friday. We bought this forex pair twice last week at the 0.7380 level, both of which ended up
We opened a third signal in NZD/USD last Friday. We bought this forex pair twice last week at the 0.7380 level, both of which ended up hitting the take profit target. So, we decided to open a third buy signal down there as this pair was retracing lower in Friday afternoon.
This forex signal got pretty close to TP again today, missing it by only a few pips. Although, it didn’t and it is now heading lower, which is not good for our trade.
Why do we keep buying down here though?zd/usd…
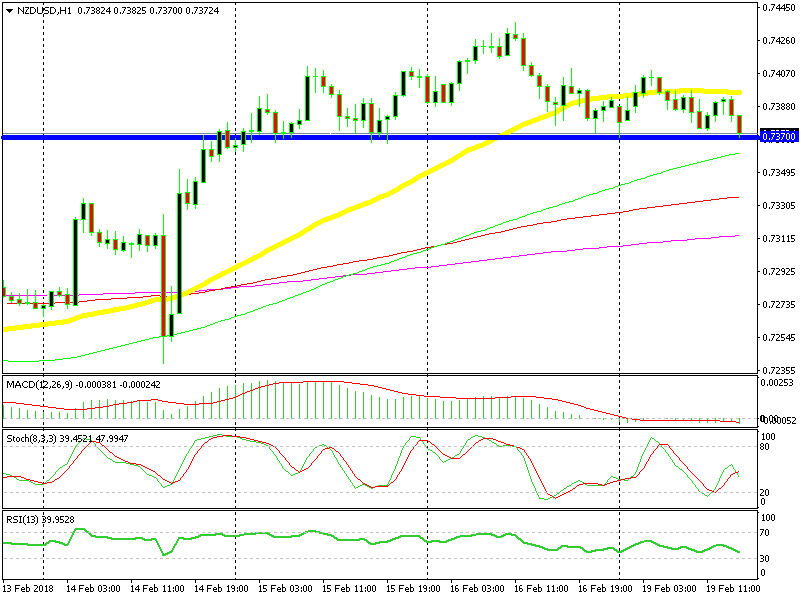
The support still holds but will it hold forever?
Well, looking at the hourly NZD/USD chart above, this area around 0.7360-70 has formed a solid support zone. As you can see, it has reversed the price higher every time the sellers have pushed down there, so it is a strong support area.
Right at the bottom of this area, we can find the 100 SMA (green). That moving average is supposed to add some extra strength to this support zone.
If you switch to the H4 chart, you can see that the stochastic indicator is oversold there. This means that the retrace lower is complete. It is true that the 0.7430 area is a major resistance level, but that’s above our take profit target. Anyway, the price has to reverse back up soon, because the USD is charging higher at the moment, which is pushing NZD/USD lower.
- Check out our free forex signals
- Follow the top economic events on FX Leaders economic calendar
- Trade better, discover more Forex Trading Strategies
- Open a FREE Trading Account
- Read our latest reviews on: Avatrade, Exness, HFM and XM
Related Articles


Sidebar rates
Related Posts
