In the previous forex update I explained why we are looking to buy the USD. Basically, the Buck is reversing, or at least it is in the middle of a decent retrace higher after trading on a bearish trend for a long time.
I was looking at AUD/USD since this forex pair has been one of the weakest among majors during the last several days. But, there were no technical indicators anywhere near to provide resistance above. SO we decided to short NZD/USD instead.
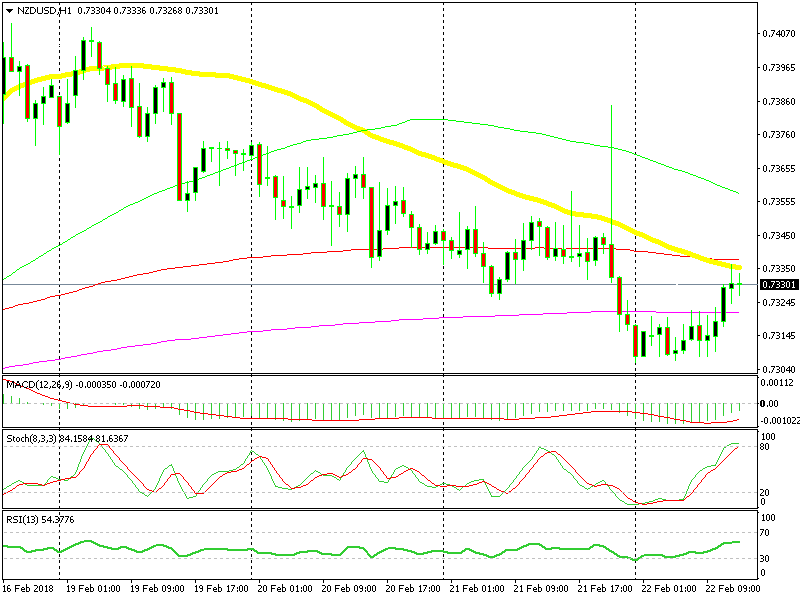
Although not as steep as AUD/USD, NZD/USD has been in a downtrend as well for nearly a week. It has lost about 100 pips during this time and the pullbacks have been pretty minimal.

There are several bearish indicators on this chart
Bearish Technical Analysis
The reverse yesterday in the evening after the FOMC minutes was pretty bearish. Right now, this pair is going through a retracement period, so we thought that this is a good opportunity to go short and try and catch some pips.
As you can see from the hourly chart above, this pair is retracing higher and it has now reached the 50 SMA (yellow) and the 100 SMA (red). The 100 SMA hasn’t been exactly the support/resistance indicator you’d expect, but it adds additional strength to this resistance area.
The 50 SMA on the other hand has been pushing the price down during the last several days, so it has acted as resistance for this pair. The previous hourly candlestick closed as a doji, which is a reversing signal as well.
Besides that, the stochastic indicator has reached oversold levels. That means that the retrace up is complete, so the downtrend should resume soon. That’s why we decided to sell this forex pair instead.


