EUR/GBP Faces Resistance on Daily Chart
The EUR/GBP has been climbing higher in the last few days and the GBP is taking a beating which is coming from Brexit comments and the Euro.
The EUR/GBP has been climbing higher in the last few days and the GBP is taking a beating which is coming from Brexit comments and the Euro.
The EUR/GBP started near the lows this week but is moving higher and trading above the 89 level, while also having difficulties pushing above 0.8930. The area around 0.8920-30 is a strong resistance level that has been providing solid resistance in the last three months.
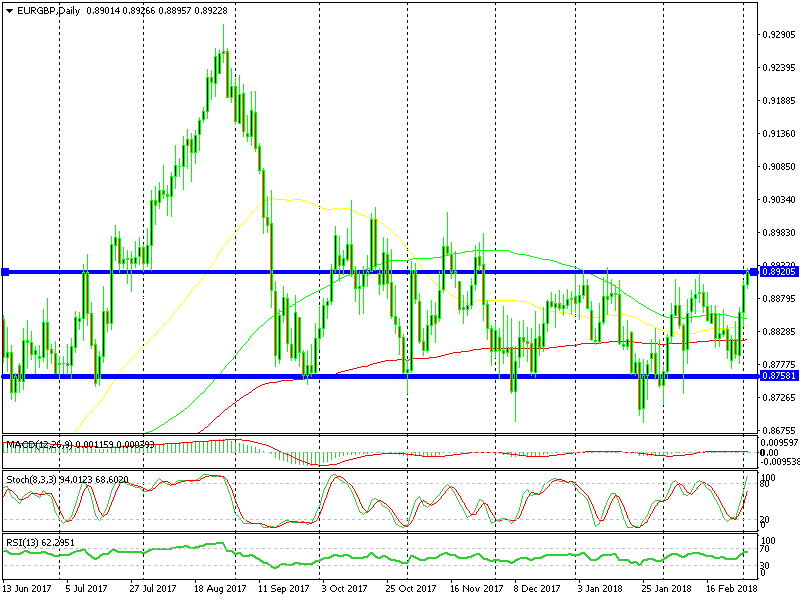
The top of the range is a good place to sell
Since December last year, this pair has reversed lower and reached the resistance, showing on the daily chart above. In fact, a range has formed in the last three months here. The bottom level at 0.8750 has been in place for nearly a year, but now a top has formed as well.
This forex pair has been trading inside the range for the last three months. It is at the top of the range after having pushed around 150 PIPs in the last three days.
We are seeing some weakness here so the selling pressure is still alive. I’m not positive we will open a forex sell signal but it does look like a good place to go short from.
If you are taking this trade, make sure to place the stop loss around 0.8950 and take profit around 100 PIPs lower. The risk/reward ratio is good, so we might as well go short on this pair soon.
- Check out our free forex signals
- Follow the top economic events on FX Leaders economic calendar
- Trade better, discover more Forex Trading Strategies
- Open a FREE Trading Account
- Read our latest reviews on: Avatrade, Exness, HFM and XM
Related Articles
Sidebar rates
Related Posts
