A Quick Look at H4 USD/JPY Chart to See Where Our Signal Stands
Earlier today we opened a sell forex signal in USDJPY. We based that signal on the H1 chart. The price had reached the 50 SMA (yellow).
Earlier today we opened a sell forex signal in USDJPY. We based that signal on the H1 chart. The price had reached the 50 SMA (yellow) which was providing resistance. The H1 chart was overbought as well since stochastic was at the top of its window.
The price moved above that moving average but found resistance at the resistance area around 105.20s. It dived back below 105 in the afternoon, but the price didn’t exactly reach our take profit target. So, we’re still on this trade. Now the price has reversed back up as the sentiment improves in the markets and we’re buck up at the resistance area round 105.20.
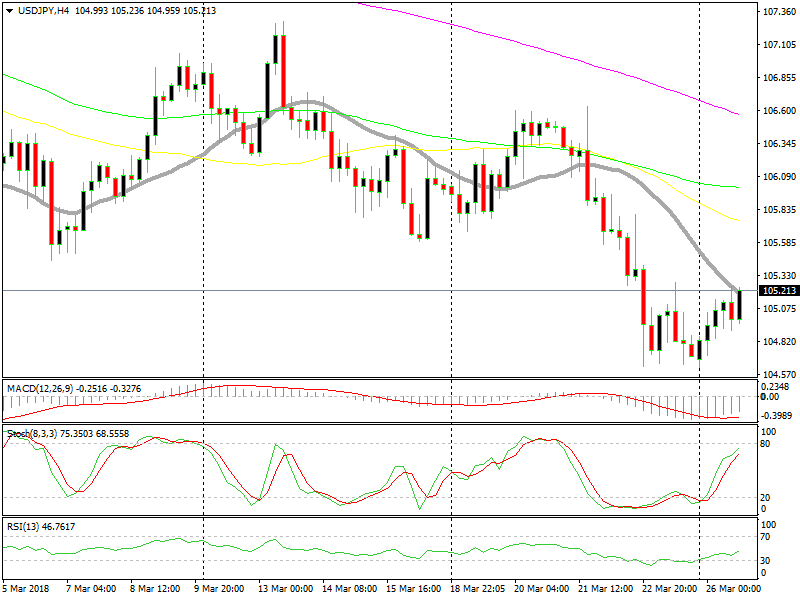
Now that stochastic is overbought, the downtrend should resume soon
Although, this time we have the help from the 20 SMA (grey). It has caught up with the price now and it should provide some form os resistance. Besides that, the stochastic indicator is overbought. This means that the retrace is almost over on the H4 chart as well. According to this chart formation, the sellers should start getting active and the downtrend should resume soon.
But, we must have the market sentiment on our side as well. This pair heads down when the sentiment is negative in the financial markets, so I hope the sentiment deteriorates soon.
- Check out our free forex signals
- Follow the top economic events on FX Leaders economic calendar
- Trade better, discover more Forex Trading Strategies
- Open a FREE Trading Account
- Read our latest reviews on: Avatrade, Exness, HFM and XM
Related Articles


Sidebar rates
Related Posts
