Forex Signals US Session Brief March 27 – New Trades Appear as the USD Makes A Comeback
Yesterday the US Dollar got hit pretty hard for no apparent reason. The market just wanted to sell the Buck and the USD suffered some...
Yesterday the US Dollar got hit pretty hard for no apparent reason. The market just wanted to sell the Buck and the USD suffered some heavy losses. Today we are seeing the opposite of the price action that we saw yesterday. The USD is claiming back yesterday’s losses and it is presenting us with some nice trading opportunities. We have had some tough time with forex signals today, so hopefully, this move will get us back to track.

All of a sudden, everybody loves the USD again
The USD Reverses Yesterday’s Tumble
Yesterday the US Dollar looked like it was going to end up down the sink as it was going down pretty fast. Our long term sell forex signal in GBP/USD was looking increasingly in danger as the price in this pair was approaching the stop loss target.
But the market reversed today and it has been a swift reversal. I wasn’t expecting such a reversal today to be honest. The US GDP report is due to be released tomorrow, so I thought that maybe forex traders would wait for that report to be released before taking sides.
But, the USD has gained around 60 pips against the Euro this morning and more than 120 pips against the GBP. The rest of the globe is siding with the UK on the UK-Russia conflict as they expel Russian diplomats from their countries. So, you’d think that this might benefit the GBP, but the GBP is losing ground fast, which is good for us.
EUR/USD is trading around 1.24 at the moment and the 50 SMA is standing just there, so there is a possibility that we see a bounce from here. I’m hoping for a bounce. If it happens and this forex pair fails to make new highs above 1.2470s, then that would be the sign I am waiting to go short on this pair. I will try to open another long term sell signal after manually closing the previous one last week.
So far, it has been a wild week, volatile and unexpected. One day, forex majors climb 100-150 pips higher for no reason, the next day, they make a head dive. This sort of market is difficult to trade because just when you think a trend has been established, everything reverses and you get caught on the wrong side.
The 100 SMA Has Turned Into Resistance for Bitcoin Now
The downtrend is cryptocurrencies continues today as well. Yesterday we highlighted the 100 SMA on the Litecoin daily chart. This moving average has been providing support for a long time in this timeframe chart. The price pierced it yesterday but eventually Litecoin closed above it.
So I thought that perhaps this moving average would hold once more. But today the price has moved considerably below it. There is a chance that Litecon reverses back up and closes the day above it, although we have to wait until the end of the day.
The same moving average on the same timeframe chart has turned into resistance for Bitcoin now. As you can see from the Bitcoin chart, the price moved back below the 100 SMA (red) earlier this month. The buyers tried to reverse the trend last week, but the 100 SMA provided solid resistance.
Eventually, the price turned lower and Bitcoin has been trading on a bearish trend since then. The rest of the crypto market follows Bitcoin, so most of major cryptocurrencies are still bearish. Although, today’s candlestick in Bitcoin doesn’t look so bearish. In fact, if Bitcoin closes the day $200 higher which is not much, then a pin would form. The pin is a reversing signal as you cans see from the Bitcoin chart below, so that would be a bullish sign. But, let’s see how the day closes first.
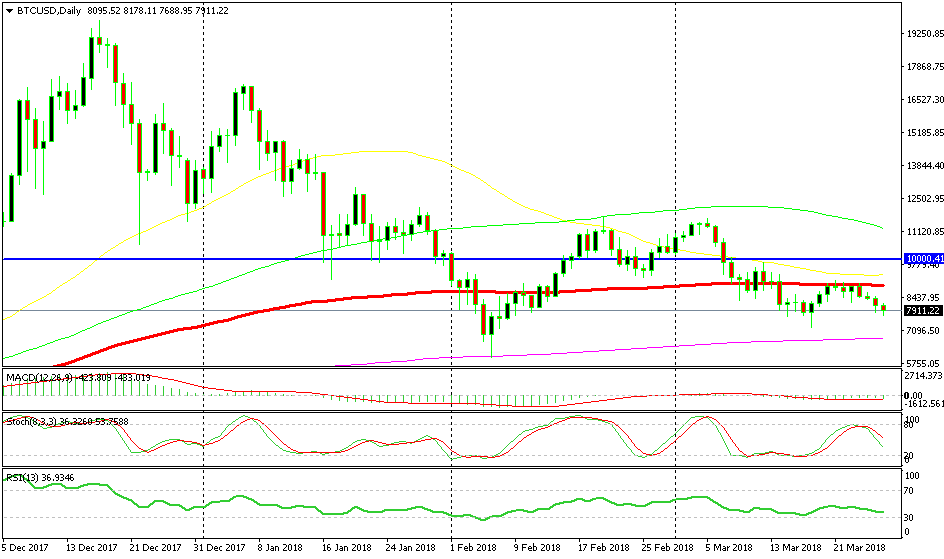
The 100 SMA in Bitcoin is doing the opposite job it has been doing for Litecoin
Trades in Sight
Short NZD/USD
- The trend has been bullish in the last several days
- The retrace down seem complete on the H! chart
- The 50 SMA (yellow) is providing support
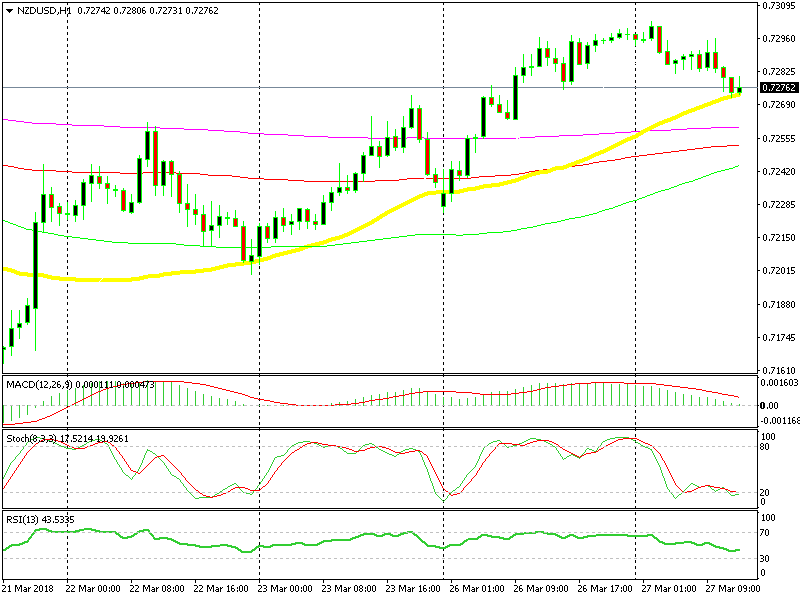
We already went long at the 50 SMA
The trend of the last several days has been bullish and today NZD/USD has retraced lower. The stochastic indicator is oversold and the 50 SMA is providing support. So, it seems as the retrace down is now complete. There are some more moving averages about 10 pips lower on the H4 chart if the sellers have funny ideas, so we have more protection lower.
In Conclusion
The economic data this week is very light, but the forex market has been quite active so far. The market sentiment has been doing all the talking this week and the sentiment has shifted pretty quickly. This sort of price action makes trading dangerous, so we are trying our best out there.
- Check out our free forex signals
- Follow the top economic events on FX Leaders economic calendar
- Trade better, discover more Forex Trading Strategies
- Open a FREE Trading Account
- Read our latest reviews on: Avatrade, Exness, HFM and XM
Related Articles

Sidebar rates
Related Posts
