S&P Tries to Built an Uptrend as It Jumps off the 50 SMA
Indices had a tough time in March, especially in the second half of the month. The risk sentiment deteriorated during that time and Gold...
Indices had a tough time in March, especially in the second half of the month. The risk sentiment deteriorated during that time and Gold surged as it is often the case with safe havens when the market falls ill.
In the last two weeks though, indices have been trying to get their act together. The decline has stopped and it looks as if they trying to recuperate now.
S&P is trying to built an uptrend and as you can see from the chart above, S&P has formed a wedge with the resistance line on the top at around $2,675. At the bottom, S&P has been following an ascending trend line.
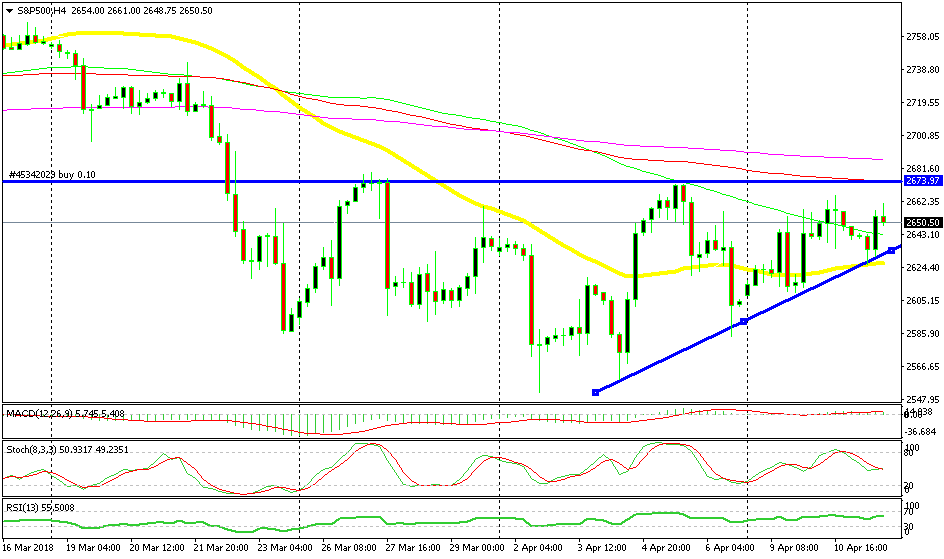
This looks like a bullish wedge
I would say that this is an uptrend, but it is not at the moment, hence the title of this update. Right now S&P is trading in a wedge and it will only be considered an uptrend when it breaks the resistance line of that wedge.
Although, it looks like S&P will enter the uptrend soon because the lows have been getting higher. The 50 SMA (yellow) provided support earlier today and the reverse higher is underway. This moving average has been resistance previously and it has turned into support now, which is another sign that the trend is changing. I’m long already on S&P so I’m not opening another trade, but you can if you want. Or, you can wait for the resistance line to be broken and go long then.
- Check out our free forex signals
- Follow the top economic events on FX Leaders economic calendar
- Trade better, discover more Forex Trading Strategies
- Open a FREE Trading Account