Gold Knocking Into Highs – Risk-off Continues to Dominate!
Gold continues to trade in a sideways channel on the back of mixed fundamentals. Better than expected U.S. economic events are placing ...
Gold continues to trade in a sideways channel on the back of mixed fundamentals. Better than expected U.S. economic events are placing bearish pressure on gold, whereas, the ongoing tensions between the United States and China are fueling safe-haven demand. I just spotted an ABCD pattern on gold which can offer us a good trade entry. Check this out…
GOLD – XAU/USD – ACBD Pattern
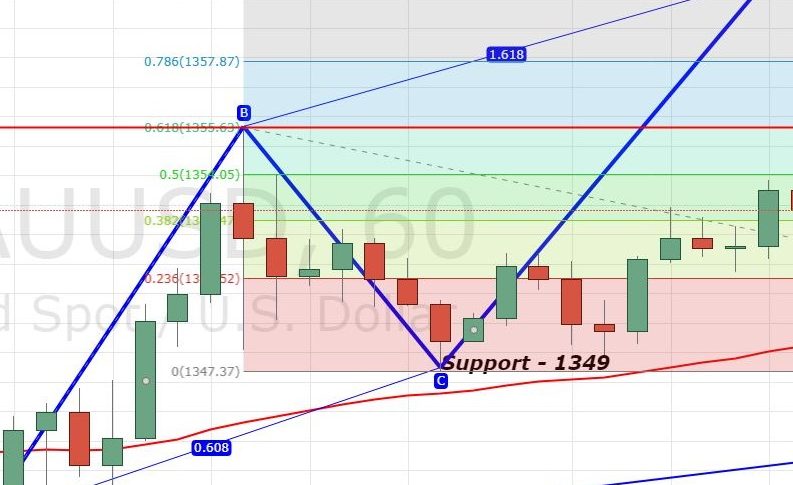
A day before, gold violated a major resistance level of $1,349 and continued to hold above this level. The bullish Gartley pattern, which we discussed yesterday, isn’t in play anymore as the trade war sentiment is driving the market now.
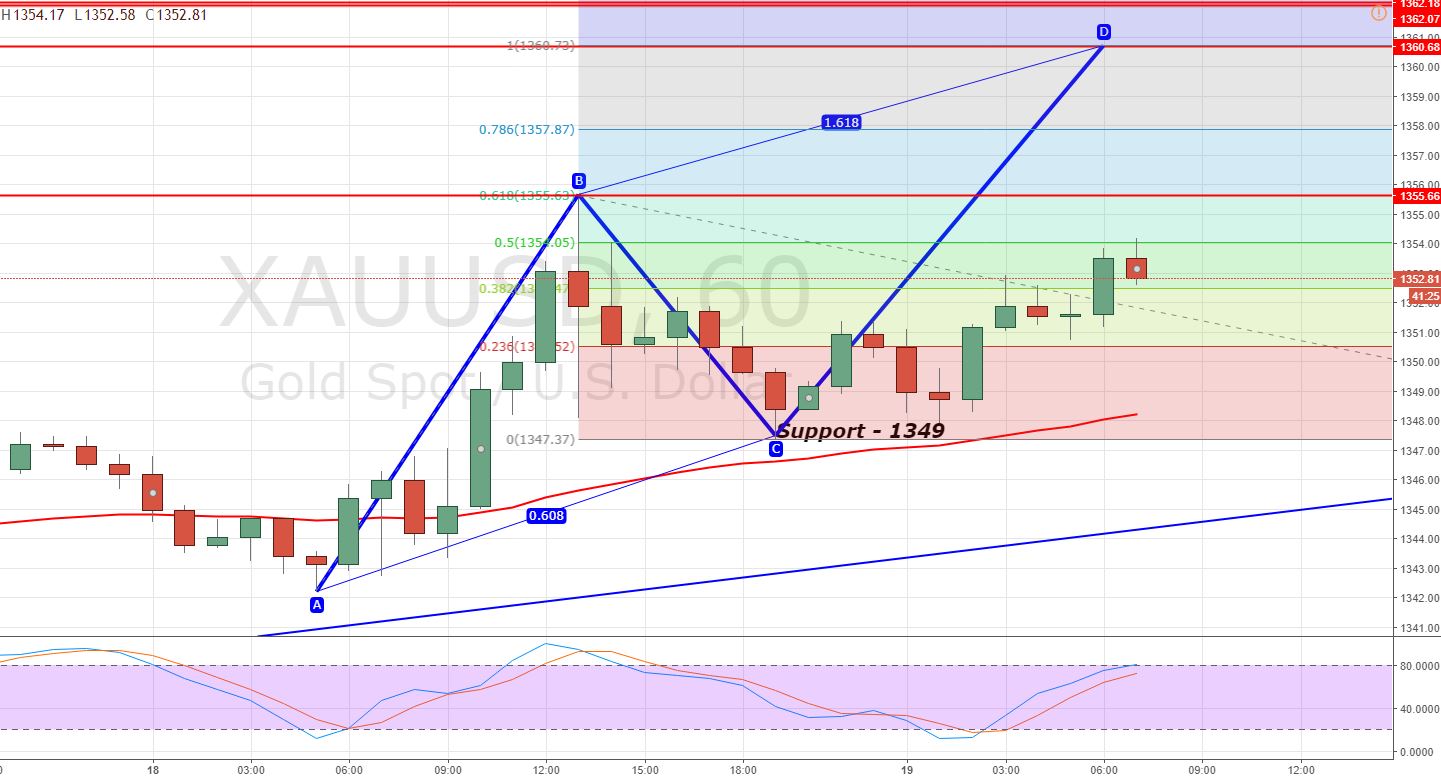
Gold – Hourly Chart – ABCD Pattern
Looking at the hourly chart, you can see a potential ABCD pattern which has already completed a B to C move at $1,349. The C to D move is expected to complete near $1,360.
RSI and stochastics are also heading upward, signaling the potential for a bullish trade. You can find fresh support and resistance levels for gold in our recent update, Gold & WTI Key Trade Levels.
Gold – XAU/USD – Trading Plan
The idea is to stay bullish above $1,352 to target $1,357 with a stop below $1,350.
Good luck!
- Check out our free forex signals
- Follow the top economic events on FX Leaders economic calendar
- Trade better, discover more Forex Trading Strategies
- Open a FREE Trading Account