Forex Signals US Session Brief April 23 – Bitcoin Turns Bullish, GBP/USD Turns Bearish
Bitcoin started making a retrace higher last week and seems as it is forming an uptrend. GBP on the other hand, is making a bearish reversal

Bitcoin started making a retrace higher last week, but it stalled below the 100 SMA. Now it has moved above it which means that the trend is really turning bullish. The GBP on the other hand, looks like is building itself up for a big tumble. That’s what I can tell from weekly and monthly charts, although let’s dig in deeper to see how valid these opinions are.

The UK flag doesn’t look so proud now
Several Major Bearish Signs in GBP/USD
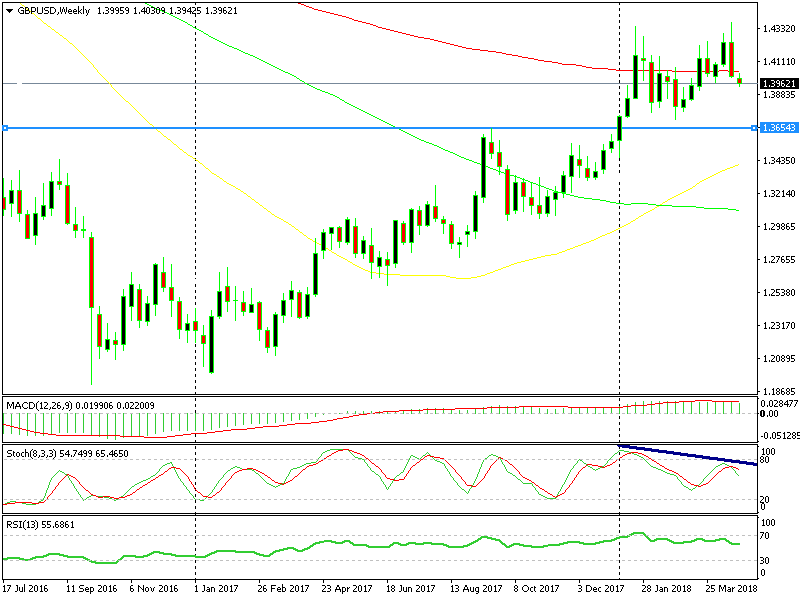
GBP/USD has been on a solid uptrend for more than a year. During this time it has claimed nearly 25 cents which translates into 2,500 pips. That’s huge considering that Brexit is still happening. It’s for this reason that we must look at the bigger timeframe chart to see the bigger trend, so we’re analyzing the weekly and monthly charts.
These two timeframe charts show that the bullish run might have come to an end. The weekly chart presents up with three major bearish signals. The first one is the 100 SMA (red). The price hasn’t really respected this moving average lately so we can’t count on it as a support or resistance level.
What it shows is whether this pair is on a bullish mode or a bearish one. Right now the price has dived below that moving average so the sentiment in GBP/USD is bearish.
The bearish engulfing candlestick looks erm, bearish
Another bearish sign is the divergence in the stochastic indicator. The highs have been higher this time compared to January, but stochastic is lower. This is a bearish divergence and it points down, obviously.
The biggest bearish sign in my book though is the bearish engulfing candlestick. Last week’s candlestick was a big bearish one which dwarfed the two previous bullish candlesticks. That opens the door for further declines in the coming weeks.
The 50 SMA did a great job this time
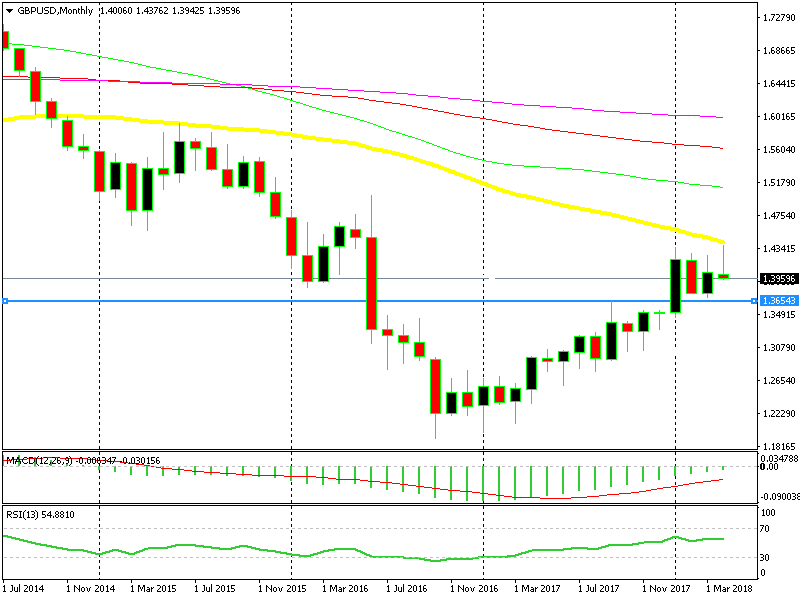
Switching to the monthly chart, we see that this pair reached the 50 SMA (yellow). It did so last week when the price climbed above 1.43, but that moving average didn’t let go. It provided solid resistance on that attempt and now the candlestick looks like an upside down pin, which is a reversing signal after the uptrend. We moved the stop loss of our long term sell forex signal above that moving average last week, hoping it would reverse GBP/USD, which it did, so it was a good decision.
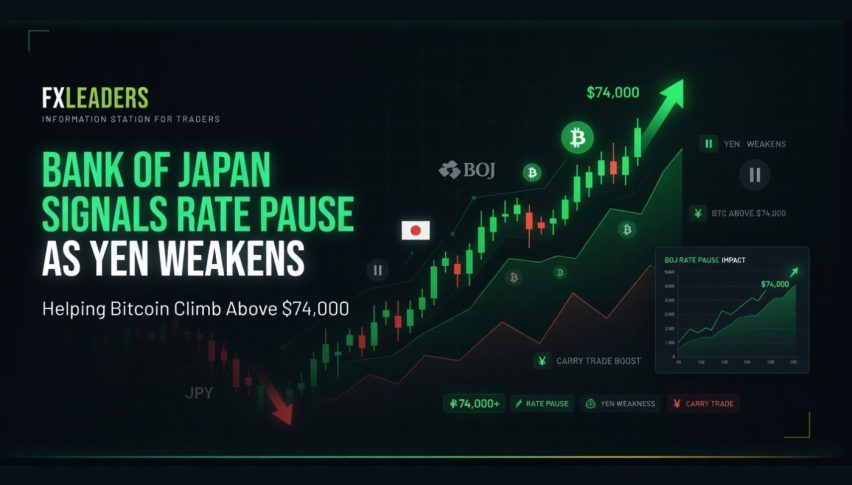
Bitcoin Finally Makes the Break
Cryptocurrencies made a jump about two weeks ago and started to for a bullish trend, but I was sceptical to consider it as a bullish move because the larger trend which started in December last year was still bearish.
Despite that, after the initial jump the upside started to lose steam and the 50 SMA (yellow) and the 100 SMA (red) were looming above our heads in Bitocin, which is the leader of the cryptocurrency market. So, the uptrend was not so sure, it might have been just a retrace before the next move higher.
But, cryptos made another jump last Friday and now it looks increasingly as the trend might be really changing. The 50 and 100 SMAs were broken and the 100 SMA is acting as support now.
If you switch to the daily Ethereum chart, you can see the same thing. The 100 SMA has been providing some decent support on the way down, so I was afraid it was going to turn into some strong resistance now. But thankfully, the buyers managed to push above it, which makes the bullish bias more credible.
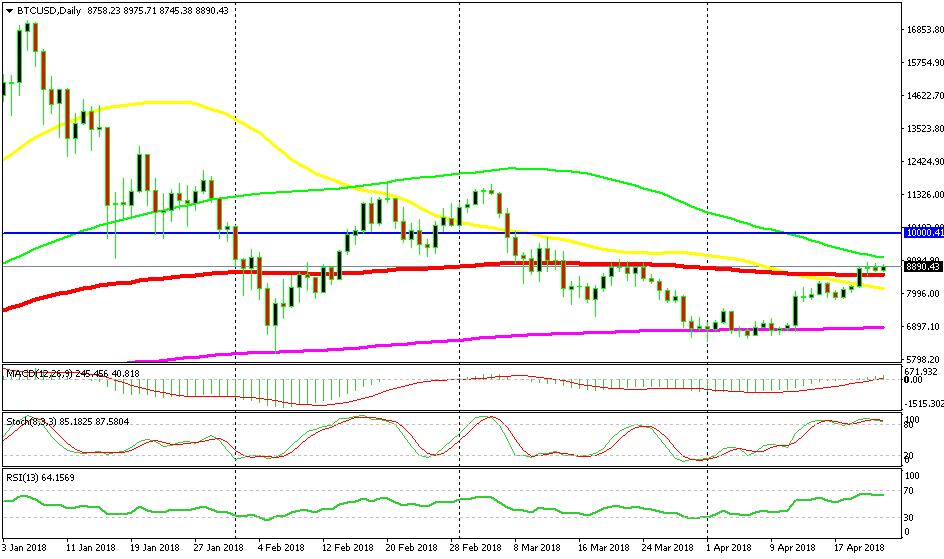
The 100 SMA has now turned into support
Trades in Sight
Bullish USD/CAD
- The trend is strongly bullish
- Commodity currencies are on a bearish roll
- The 20 SMA is providing support
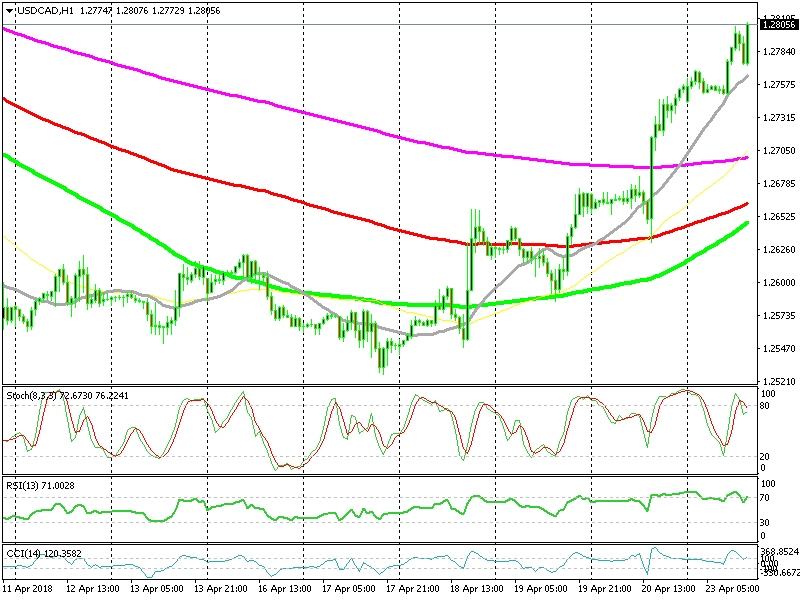
The uptrend has picked up pace
I was trying to open a buy forex signal in USD/CAD but I missed the opportunity just now. I was waiting for the price to reach the 20 SMA (grey) which provided support early this morning, but the price reversed about 10 pips above it, so we missed that opportunity. Although, I will still try to buy at that moving average if USD/CAD retraces back there again today since the market sentiment is really bullish for this pair.
In Conclusion
Commodity prices continue to decline today as the US Treasury continues with sanctions on RUSAL, the Russian aluminium giant. The commodity Dollars continue to suffer as a result, so we keep the bearish bias for AUD/USD and NZD/USD and the bullish bias for USD/CAD.
- Check out our free forex signals
- Follow the top economic events on FX Leaders economic calendar
- Trade better, discover more Forex Trading Strategies
- Open a FREE Trading Account
- Read our latest reviews on: Avatrade, Exness, HFM and XM
Related Articles


Sidebar rates
Related Posts
