Forex Signals U.S. Session Brief April 25 – A Big Bearish Candle in Cryptocurrencies. Is This the End of the Bullish Run?
Two are the things that we can spot right away today just by a quick glance at the charts, the USD strength and the weakness in cryptos
Two are the things that we can spot right away today just by a quick glance at the charts. The first is the strength in the USD which has been going on for about a week now. The second is the big bearish candlestick on the daily chart of major cryptocurrencies. They were on a bullish run, so is this the end of the uptrend and the beginning of a downtrend?
Double Top Pattern on the GBP/USD
We have covered the GBP/USD quite a few times recently, but we missed something important. We can all see the reversal that this pair made last week and the downtrend that has followed since last Tuesday.
The economic data from the UK has showed signs of weakness which has forced the Bank of England to soften their hawkish talk. The market was expecting a rate hike in May, but now, we don’t know when the next rate hike will come.
So fundamentally, this pair has turned bearish too, but what we missed is the double top formation on the daily chart. As you can see from the chart below, this pair has formed a double top at 1.4350 while the neckline comes at 1.37. You know how the double top pattern works: when the price breaks the neckline, then the target on the downside is as big as the distance from the top to the neckline.
You can trade double tops as the pair starts reversing down from the top. However, you should get a confirmation that the reversal is happening. The signal, this time, came after the GBP/USD popped above the first resistance at 1.4350 and then came back down again. That was a sign that the buyers didn’t want to push higher, just triggering some weak stops above the resistance, that’s why we moved the stop above 1.44 for our sell signal here.
However, the correct way to trade this according to textbooks is to wait for a break of the neckline and then go with the market’s momentum. So, you can go short once 1.37 is broken if you haven’t done it already. The target would be somewhere around 1.3250.
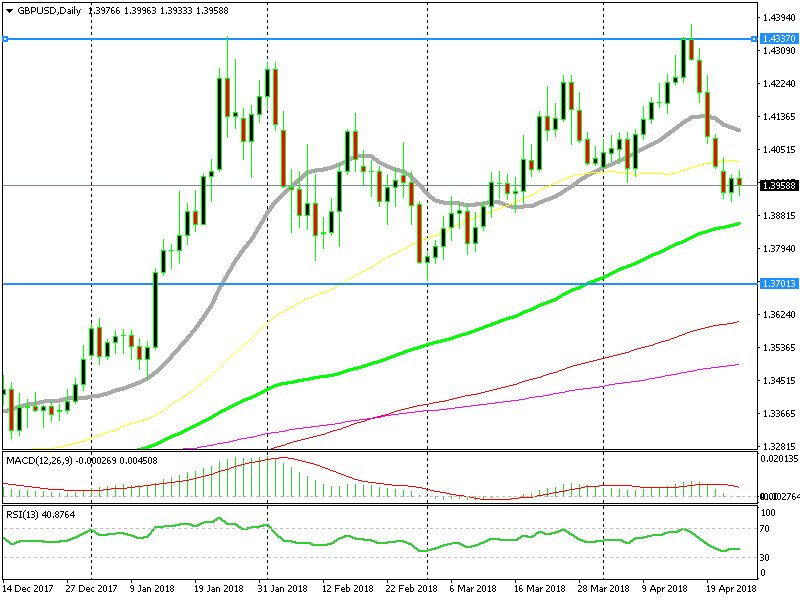
If the double top works, then we should make some good pips with our signal.
Litecoin Can’t Make the Break
Cryptocurrencies turned bullish three weeks ago after having traded on a bearish trend for several months. The reversal took place at the 200-SMA (purple) on the daily chart of most major cryptos. The climb hasn’t been that easy, but altcoins have managed to break level after level.
It was the 100-smooth MA (red) which got broken first, then came the 50-SMA. Bitcoin broke above the 100-simple MA as well but ether(ethereum) and litecoin couldn’t. That moving average provided solid resistance yesterday and today we see a big reversal on the daily chart.
The daily candlestick looks like a big bearish one so far, although there is still plenty of time until the day closes. On the bright side for buyers, the 100-smooth MA (red) is providing support for litecoin.
So, is the uptrend over?
If the 100-SMA (red) gets broken then the uptrend is history. If it holds today and the price starts reversing higher, then probably not. The 100-SMA makes that decision now.
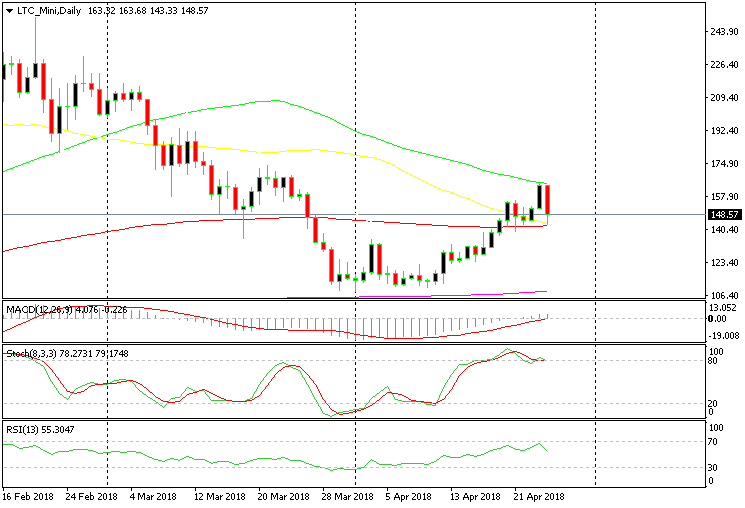
This daily candlestick doesn’t look good for buyers
Trades in Sight
Bearish EUR/USD
- The trend is strongly bearish
- The 1.22 level has turned into resistance now
- The 50-SMA is pushing the price down
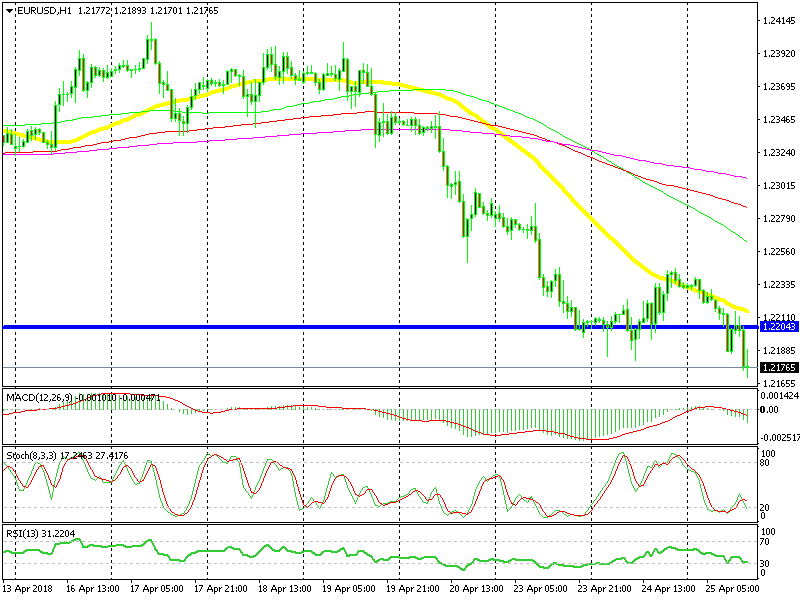
The downtrend is stretching further today
Earlier today I highlighted the opportunity we missed last night when this pair was retracing up. It reached the 50-SMA (yellow) and then it reversed back down, resuming the downtrend. The EUR/USD kissed the 50-SMA again today and reversed lower once more after printing two doji candlesticks. We can see that there is strong selling pressure and the 50-SMA is not letting go, so we’re going to sell at the 50-SMA if we see another pullback up.
In Conclusion
The USD strength continues today as well. We saw a halt yesterday followed by a consolidation, but today the uptrend has resumed again and the U.S. Dollar remains in charge. There’s not much on the economic calendar today, so we will try to read the price action to understand the market sentiment.
- Check out our free forex signals
- Follow the top economic events on FX Leaders economic calendar
- Trade better, discover more Forex Trading Strategies
- Open a FREE Trading Account
- Read our latest reviews on: Avatrade, Exness, HFM and XM
Related Articles


Sidebar rates
Related Posts
