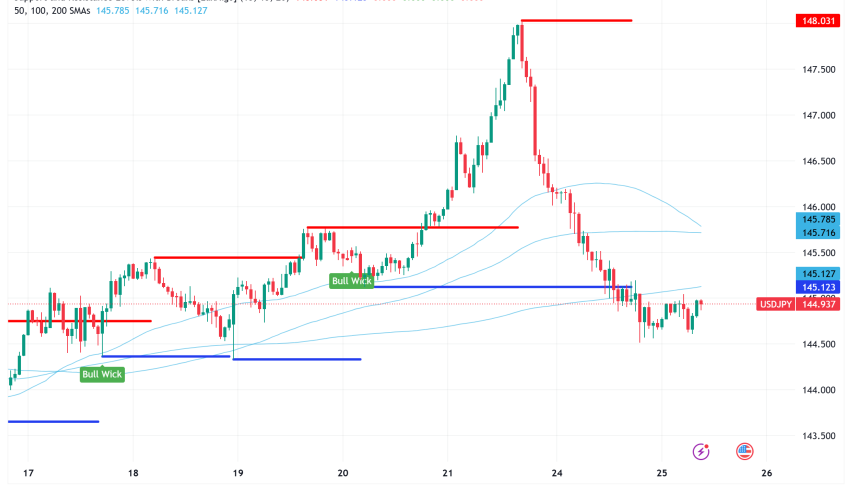
USD/JPY Bulls Face A Big Obstacle
The first quarter of this month was really terrible for USD/JPY bulls. But it reversed up and now it is facing an important indicator.
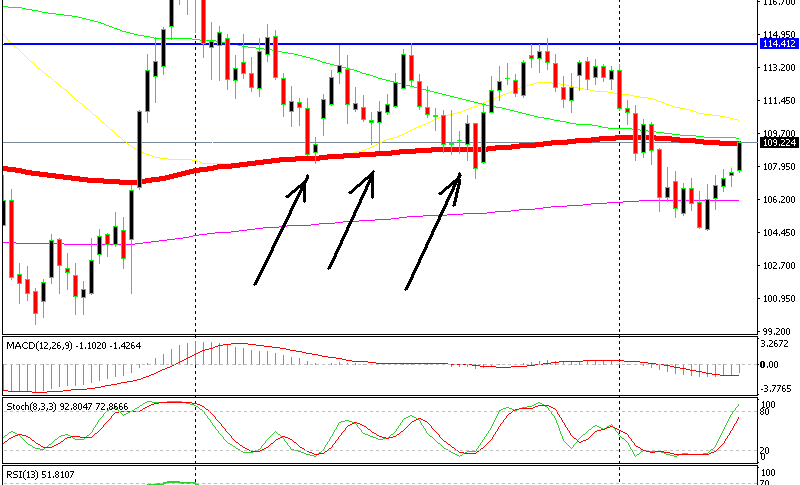
The first quarter of this month was really terrible for USD/JPY bulls. This forex pair began to slide down and eventually it snowballed all the way to 104.50s, from 114. That’s nearly a 10 cent decline in a few months.
Nevertheless, this pair found support at the 100-SMA on the monthly chart and in the last couple of weeks, it reversed higher. So, the USD/JPY has been on an uptrend in the last couple of weeks. The uptrend has been steep and we can see five consecutive bullish candlesticks in the chart above.
But now, the same moving average which provided support on the monthly chart and reversed the decline is situated just above the current candlestick. This moving average has provided support many times on the weekly chart as well.
It was the ultimate support last year; the USD/JPY never broke below it the entire year. The previous year it was a strong resistance indicator, so the 100-SMA (red) is a major support and resistance indicator. It’s for this reason that I see a good chance of a reversal starting here. It might not be a downtrend, but a decent pullback is due on the weekly and daily charts.
The stochastic indicator is overbought as well, which means that this move upward is overdone now. We might or might not open a long-term sell forex signal here because safe haven currencies are getting battered (which is pushing the USD/JPY into a good level to sell it), but the chart setup looks tempting for sellers who want to target around 200-300 pips. I would be placing the stop above 1.10 by the way.
- Check out our free forex signals
- Follow the top economic events on FX Leaders economic calendar
- Trade better, discover more Forex Trading Strategies
- Open a FREE Trading Account