Choosing Between the Daily and the Weekly Chart in Bitcoin – Decision Time
The daily Bitcoin chart is turning bullish. We are trying to go long, but the weekly chart is contradicting, so decision time now.

We had a long-term buy forex signal in Bitcoin until a few weeks ago. We had to reopen it a few times because we had some technical issues as we migrated to the new FxLeaders site. You may have noticed it if you have been following us for more than 2 months. Now that the migration to the new site is complete, we are thinking of opening another forex signal in Bitcoin. There is an interesting chart setup on the daily timeframe, but that’s in contradiction with the setup on the weekly chart. The weekly Bitcoin chart is telling us to sell, while the daily chart is screaming buy.
The Daily Chart Setup
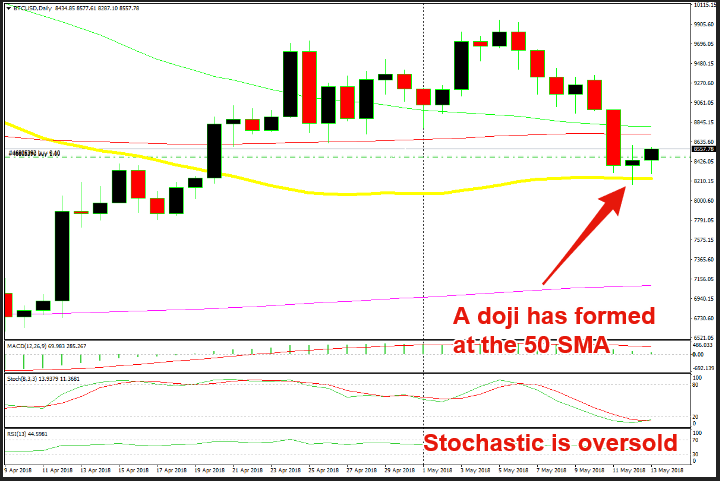
The chart setup on the daily timeframe looks great for buyers. The trend reversed in early April, from bearish to bullish on this chart. That reverse happened at the 200 SMA (purple). The 200 SMA had provided support back in February during the massive selloff during the first few months of 2018. So, it wasn’t a big surprise that this moving average was going to be the turning point if there was going to be a turning point.
The reverse happened right there and the uptrend has been consistent since then. The pressure has been on the upside, so the pullbacks have been shallow. According to this time-frame chart, we are on a bullish run and according to the trend trading strategy, the retrace lower is a good opportunity to get in on the long side.
This pullback looks damn sure complete. The stochastic indicator shows when a currency is overbought or oversold and right now it is totally oversold on the daily chart. This means that the retrace is complete.
Although, one indicator alone isn’t ever going to cut it for me. You might know by now if you have been following my market analysis. Sometimes, just one indicator is enough, but the more the merrier. Lucky enough, we have more technical indicators pointing to a bullish reversal after the latest pullback.
The price has been trying to break below the 50 SMA (yellow) in the last three days, but it seems like the sellers are failing. If you scroll back on your daily chart, you will see that this moving average has provided support back in December last year when the massive bearish wave started in Bitcoin and other major cryptocurrencies.
Although, it eventually broke. But now, it seems like this moving average has turned into support again now that the price has moved above it. One of the strongest signs for me though is the daily candlestick from yesterday. It closed as a doji or a spinning top if you want to call it that. That is a strong reversal sign after the bearish retrace. Today’s candlestick looks bullish too, but there’s still plenty of time until it closes, so let’s not get carried away with that one.
This makes it four technical indicators pointing up, which are:
- The bullish trend
- Oversold stochastic
- The 50 SMA
- The daily candlesticks
The chart setup here shows that Bitcoin is reversing
The Weekly Chart Setup
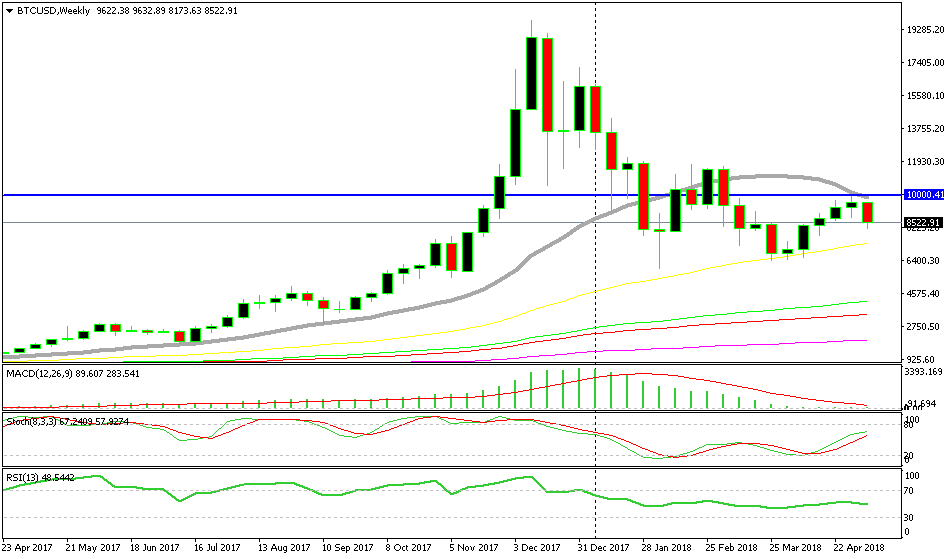
We could have taken a trade right now based on the chart setup of the daily timeframe. But, the weekly chart is showing a different picture. This chart looks bearish and the trend here is still down, so that’s one of the main concerns for me.
Another concern for buyers is the weekly stochastic. It is almost overbought now. There is still some more room left on the upside to run further north, but at the moment it is turning down, which is not a good sign.
Although, the biggest bearish sign is the candlestick formation of the last two weeks. Last week, the price formed a doji, which again, is a reversing signal. That pattern becomes even more bearish when it is followed by a bearish candlestick, such as the one this week. That’s a big bearish candlestick worth around $1,500 from top to bottom.
I could add a paragraph on the fundamental analysis, but it seems as if the market has left the fundamentals aside for now. Fundamental events are not having much impact on cryptocurrencies nowadays like they used to until a few months back. So, it is all about technicals now.
The weekly chart doesn’t look bullish at all though
The Conclusion
After evaluating the technical picture on the weekly chart, my concern is that the sellers will target the 50 SMA (yellow) again. If that’s the case, then we can’t go long right here, as the daily chart suggests. We will have to wait until the price reaches the 50 SMA which is more than $1,000 lower.
On the other hand, the daily chart setup looks really bullish. So, what do we do? Decision time guys. We could wait until Bitcoin reached the 50 SMA on the weekly timeframe. But the daily chart might take over so the fall to 50 SMA might not happen and we might just lose the opportunity.
Well, I don’t want to be left out of this bullish reverse. So, I will try to open a long-term buy forex signal today. I am looking at the hourly chart now to see if we can get a better and lower entry price and it seems as if we can. The H1 chart is overbought and turning down at the moment, so we will wait a few hours until Bitcoin retraces lower on the H1 chart and becomes oversold. Then, we will go long with stop loss below the 50 SMA on the weekly chart.
- Check out our free forex signals
- Follow the top economic events on FX Leaders economic calendar
- Trade better, discover more Forex Trading Strategies
- Open a FREE Trading Account