Shorting GBP/USD at the 100 SMA
We just opened a forex signal in GBP/USD if you heard the sound. We decided to go short on this pair just below the 100 SMA

We just opened a forex signal in GBP/USD if you heard the sound. We decided to go short on this pair just below the 100 SMA as the title of this forex update suggests. This moving average has been providing resistance for several days, both on the H1 and on the daily forex chart.
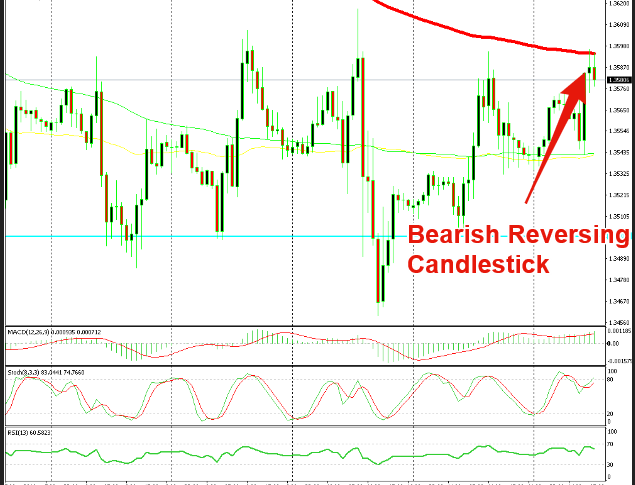
The chart setup on the daily timeframe is pretty straightforward. The 100 SMA (red) is providing resistance on the top, right at 1.36 and that’s it. Although, considering that this is the daily chart, a major indicator at a major resistance level is more than enough to scare buyers off.
But, we based this forex signal on the H1 chart. GBP/USD has turned bearish recently as Brexit approaches. The price is overbought on this timeframe chart as you can see from the picture above. The stochastic indicator is overbought, so the bullish move should be over.
The signal that this move is over comes from the candlesticks. The previous candlestick closed as a doji. That sort of candlestick points to a possible reversal soon. So, besides the overbought stochastic, we have the candlestick formation which is pointing to a bearish reversal soon.
Another chart setup which we are playing with this signal is the range. GBP/USD has formed a 100 pip range between 1.35 at the bottom and 1.36 at the top. We are trading just below the top of the range now. If you switch to the H4 chart, you will see that the price is overbought on this timeframe as well, so according to the range strategy, we should see GBP/USD reverse back down now. This makes it four technical indicators pointing to a bearish reversal, so we went short on this pair.
- Check out our free forex signals
- Follow the top economic events on FX Leaders economic calendar
- Trade better, discover more Forex Trading Strategies
- Open a FREE Trading Account


