Gold Stuck In an Asymmetric Triangle – Breakout Awaited
The gold prices are stuck in a narrow trading range of $1,287 - $1,294 has the greenback is hovering below its 2018's high. Additionally...

The gold prices are stuck in a narrow trading range of $1,287 – $1,294 and has the greenback hovering below its 2018 high. Additionally, a drop in the U.S. stock indices and rising Treasury yields are collectively impacting the prices of safe-haven assets. In this scenario, where fundamentals are causing indecision among bulls and bears, the best is to trade technical setups. Here’s one for today…
Gold – XAU/USD – Technical Outlook
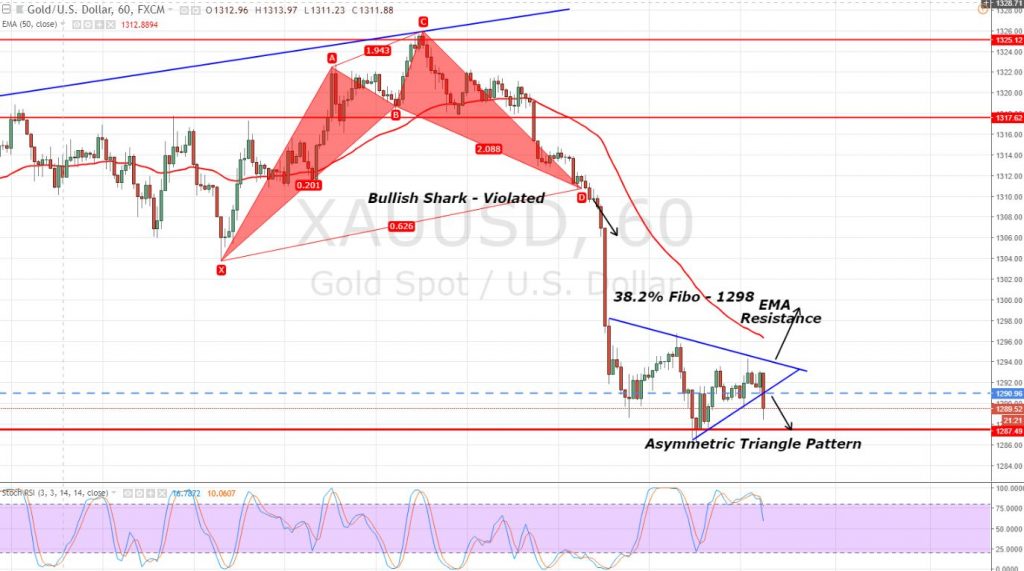
Highlighting the technical side, the leading indicators, both the RSI (above 80) and Stochastics (at 74), are indicating overbought conditions, though, so sellers could return from here and attempt to break out to the bullish trendline.
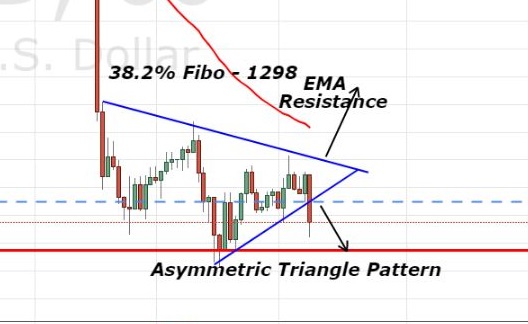
On the hourly chart, the yellow metal is stuck in an asymmetric triangle which is supporting gold near $1,289 along with a resistance near $1,293. Soon we are going to see a breakout in an asymmetric triangle pattern, perhaps, on a lower side. I’m saying this because the leading indicators have started coming out of the overbought zone.

Gold – Hourly Chart
However, on the daily timeframe, gold has formed a candlestick pattern doji. This pattern often imposes a threat to sellers as it signals a neutral sentiment of investors. Doji followed by a sharp selling which indicates that the sellers are exhausted and we may see bulls buying the cheaper gold.
Gold – XAU/USD – Trade Idea
Today, the idea is to stay bearish below $1,291 with a stop above $1,293 to target $1,286. The violation of $1,286 can lead gold towards $1,281. Whereas, gold can remain bullish above $1,291. Good luck.
- Check out our free forex signals
- Follow the top economic events on FX Leaders economic calendar
- Trade better, discover more Forex Trading Strategies
- Open a FREE Trading Account


