EUR/USD Stretches the Slide, but Now Facing A Major Support Level
EUR/USD has been on a solid bearish trend for weeks now. Although, there is one major support level which stand in the way. Will it let go?
As I mentioned in the previous forex update, the uptrend in the US Dollar continues to evolve further this week. That means that EUR/USD is making new lows. This morning EUR/USD lost 55 pips in a swift slide which didn’t face any obstacles along the way.
Resistance Turned Into Support
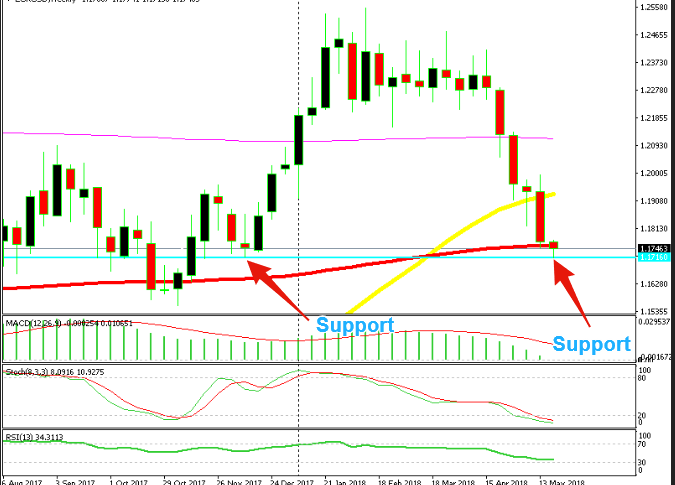
Although, there is this major support and resistance level right where the slide ended about an hour ago. The decline stopped at 1.1715 and we are seeing a pullback higher at the moment. This is the major level I am talking about. 1.1714 was the top back in August 2015 when the flash crash happened in Chinese stock markets.
This forex pair had been trading on a strong bearish trend for about a year when the spike higher happened in EUR/USD. But, this level resisted well and EUR/USD reversed back down and resumed the bearish trend. So, it became the last defense line for sellers.
Other defense lines for buyers in this pair were 1.1450, 1.15 and 1.1600-15, which are now the defense lines for sellers. But, we are still trading in the 1.1750 zone, so let’s just think about the first support level which has now turned into resistance.
Support Levels for EUR/USD
- 1.1700-20 (Strong) bearish
- 1.1600-15 (Strong)
- 1.1550 (Medium)
- 1.1500 (Strong)
- 1.1450 (Medium)
This level turned into support immediately after it was broken to the upside. Then it provided support again in August, October and December last year. So, now we are facing this major level. It rejected the price in the first attempt this morning, which means that the buyers and the sellers are very aware of this level.
The rejection might be encouraging for EUR/USD buyers. But, I wouldn’t put too much trust in it. Two weeks ago, the weekly candlestick closed as a doji and the 50 SMA (yellow) resisted, but the big bearish candlestick from last week ruined that bullish chart reversal pattern. Last week’s 200 decline keeps the sellers in control. The 100 SMA (red) is another obstacle in the way for sellers since we are trading around it at the moment, but that moving average has been pierced today, so it has weakened. We don’t know when the 1.1715 level will be broken, but from the weekly and the monthly charts, it seems like it won’t resist too long, let’s see.
- Check out our free forex signals
- Follow the top economic events on FX Leaders economic calendar
- Trade better, discover more Forex Trading Strategies
- Open a FREE Trading Account
- Read our latest reviews on: Avatrade, Exness, HFM and XM
Related Articles


Sidebar rates
Related Posts
