A Dramatic Dip In Gold – Asymmetric Triangle Eyed for Support
On Monday, gold traded bearishly, falling further beneath the $1,300 level amid fading safe-haven demand on the back of reducing...

On Monday, gold traded bearish, falling further beneath the $1,300 level amid fading safe-haven demand on the back of reducing geopolitical tensions. Once again it’s President Trump behind it. The demand for risky investments boosted after Trump declared on Sunday that a U.S. team had entered North Korea for the preparation of a historic summit between him and North Korean leader Kim Jong Un. As you know, the lack of uncertainty hurts safe haven investments like gold and helps stock indices to boost.
By the way, we don’t have any economic event as the market is enjoying the holiday. But gold is forming an exciting trade setup. Let’s check it out…
Gold – XAU/USD – Triangle Pattern In Focus
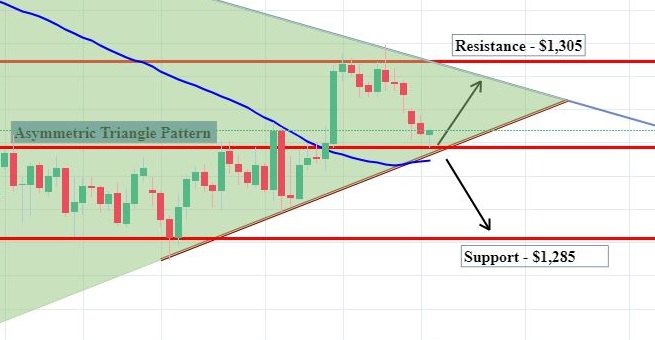
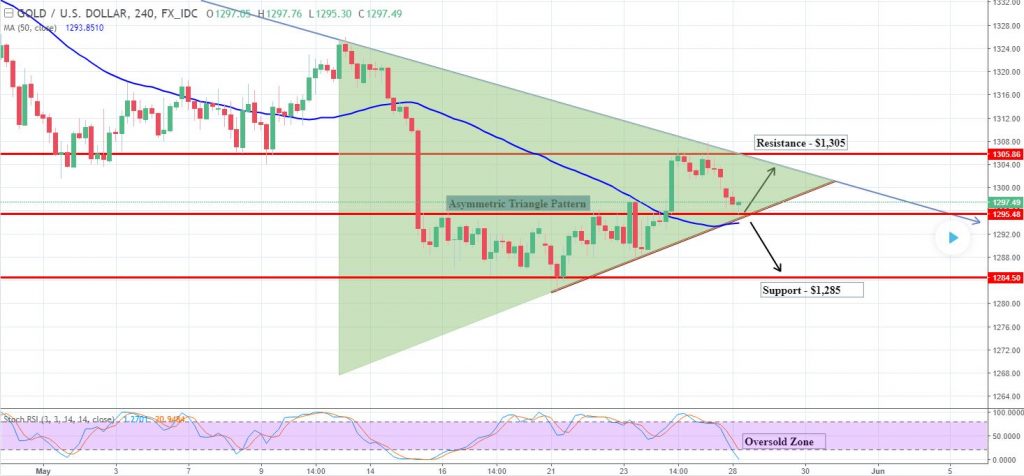
On the 4-hour chart, gold has formed an asymmetric triangle pattern which is supporting the pair near $1,295 along with a resistance at $1,305. Sooner or later, we may see a breakout in an asymmetric triangle pattern. Unlike ascending and descending triangle pattern, the asymmetric triangles can breakout to any direction. So, better be prepared for it.

However, considering the thin trading volume and lack of economic data, we can expect gold to continue trading in the range $1,295 – $1,305. Both leading indicators, RSI and Stochastics, have entered the oversold zone signaling that sellers could return from here and attempt to bounce off the support level of $1,295.
Gold – XAU/USD – Trade Idea
During the London session, we opened a forex trading signal to buy gold above $1,297 with a stop below $1,294 and a target of $1,301. Good luck.
- Check out our free forex signals
- Follow the top economic events on FX Leaders economic calendar
- Trade better, discover more Forex Trading Strategies
- Open a FREE Trading Account


