Choppy Gold Trade – A Potential Breakout Setup
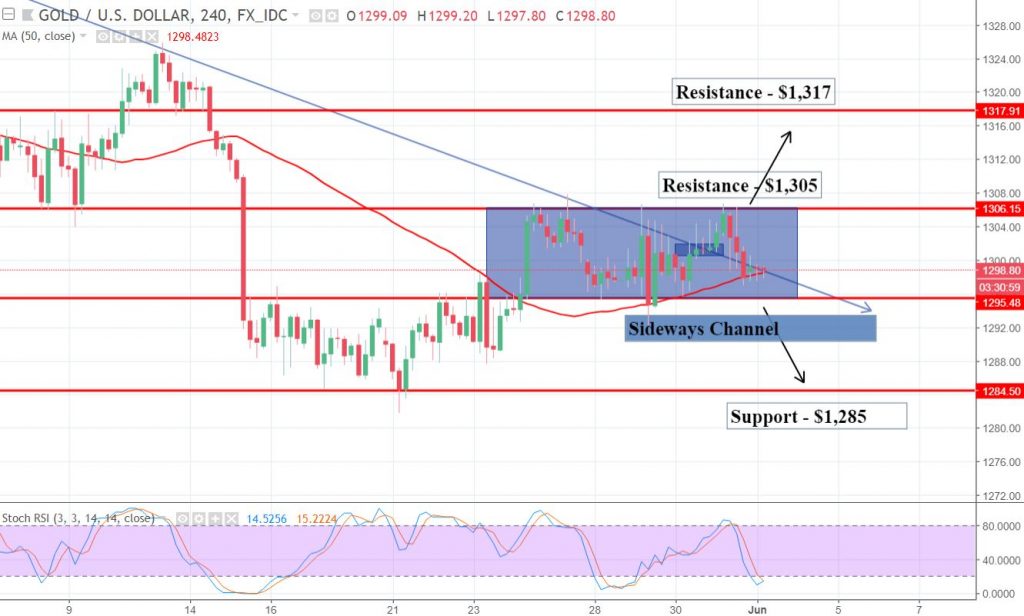
Despite the volatile session, the gold prices are stuck in a narrowly mixed range of $1,295 - $1,305. Now, the game is in the court of the..

Despite the volatile session, the gold prices are stuck in a narrowly mixed range of $1,295 – $1,305. Now, the ball is in the U.S. Nonfarm Payroll’s court. Today’s labor market data is of interest not only to traders but also to central banks. Since it’s being released before the June 13 FOMC meeting, it could have an influence on the decision of FOMC members regarding the next rate hike. Check out FX Leaders’ June 1 – Economic Event Report to learn about NFP expectations.
Gold’s Technical Analysis – Sideways Channel
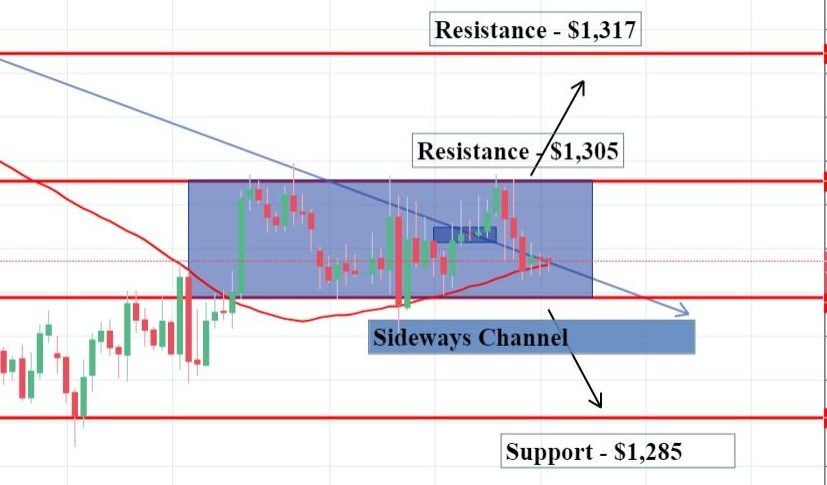
On the 4-hour chart, gold is testing $1,295, probably for the 8th time now. On Thursday, the precious metal soared below $1,306 but failed to violate this triple top resistance at $1,306. For the moment, the yellow metal is holding below a solid resistance level of $1,306 which is extended by sideways channel. This pattern shows the indecision among investors and could breakout in any direction.

Gold – 4-Hour Chart
Fortunately, we have already spotted the pattern and we also know the time of a potential breakout. The violation of $1,306 level can open further room for buying until $1,311 and $1,317. The support prevails at $1,287 and $1,281.
Support Resistance
1296.57 1304.37
1294.17 1306.77
1290.27 1310.67
Key Trading Level: 1300.47
Gold – XAU/USD – Trading Idea
The idea is to buy above $1,295 and sell below $1,305, with a stop loss of 30 pips and take profits on 50 pips. Outside this range, we can set the buy stop above $1307 and sell stop of $1,294 to target 50 pips. However, it’s a risky strategy if we get mixed data today. Trade with care and good luck!
- Check out our free forex signals
- Follow the top economic events on FX Leaders economic calendar
- Trade better, discover more Forex Trading Strategies
- Open a FREE Trading Account


