The Major Technical Indicator Gives Up in Bitcoin
Bitcoin and other major currencies have been on a bearish trend for quite some time. They turned bearish in late December after the...

Bitcoin and other major currencies have been on a bearish trend for quite some time. They turned bearish in late December after the gold rush for cryptos at the end of 2017. The downtrend stopped for some time in April and we saw a pullback take place. Bitcoin got close to the $10,000 level but failed o break it and the bearish trend resumed again.
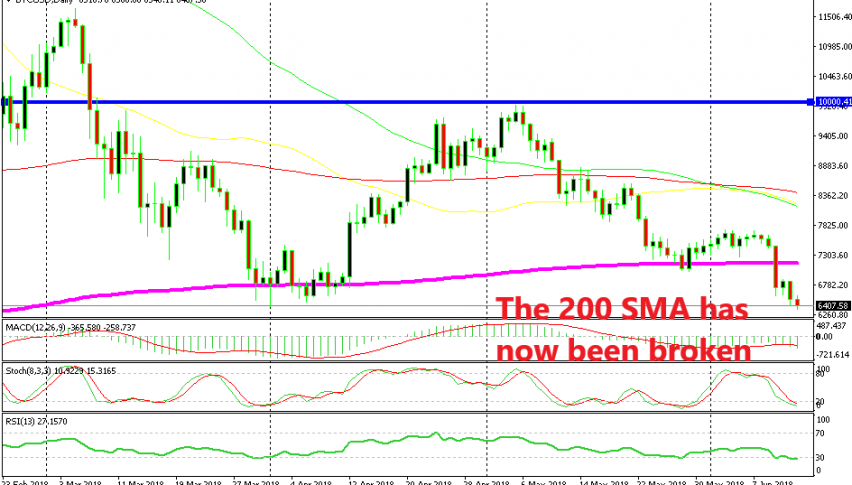
Although, the buyers had one last indicator to put their trust on. It was the 200 SMA (purple) on the daily chart. As you can see from the chart above, the 200 SMA has been providing solid support in the last several months. It held ground during the first major decline in February, then it provided support in March and again at the end of May.
Technical indicators on volatile instruments with such large time-frames don’t work exactly to the pip. You can see that the price has pierced this moving average, but the area around it has done the job well in providing support.
Now though, the 200 SMA has been broken fair and square. The price broke below it on Sunday with considerable pace and the daily candlestick closed around $500 below the 200 SMA, so the break was clear that day.
On Monday, the price formed a small bullish candlestick, but that was too small to reverse the decline, especially when compared to the previous candlestick. Yesterday, the bearish trend stretched further down and today the sellers remain in control again. Now there is no technical indicator to stop the decline in Bitcoin, apart from February’s low which comes at $6,000. Bitcoin is still $400 away from it so we will have to see how the price reacts when we get down there.
- Check out our free forex signals
- Follow the top economic events on FX Leaders economic calendar
- Trade better, discover more Forex Trading Strategies
- Open a FREE Trading Account


