Gold Prices Go Up – U.S. Economic Indicators Disappoint
On Thursday, the gold soared sharply near $1,269 after the release of worse than expected Philly Fed manufacturing index. The index fell...

On Thursday, gold soared sharply near $1,269 after the release of worse than expected Philly Fed manufacturing index. The index fell to 19.9 vs. 28.9 forecast. The data not only missed the forecast but also came out way less than the previous figure of 34.4. Safe haven assets are also in demand due to the ongoing news from China and the U.S. Anyway, let’s look at the technical outlook of the market.
Gold – XAU/USD – Quick Technical View
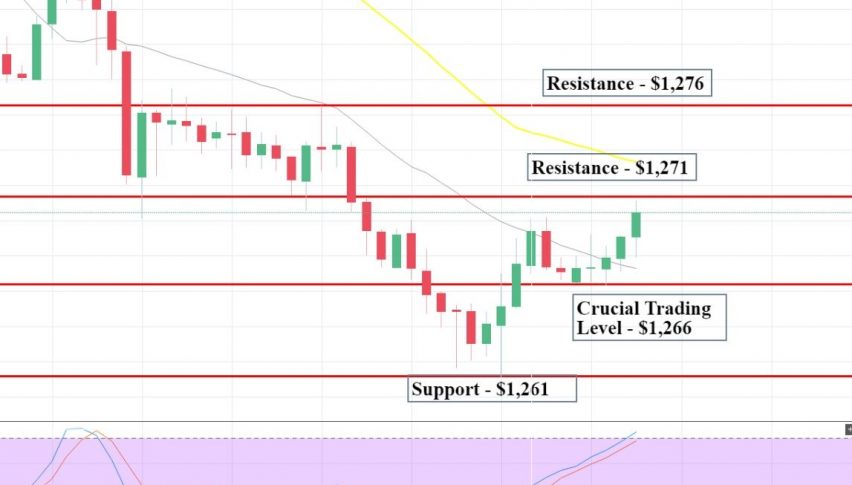
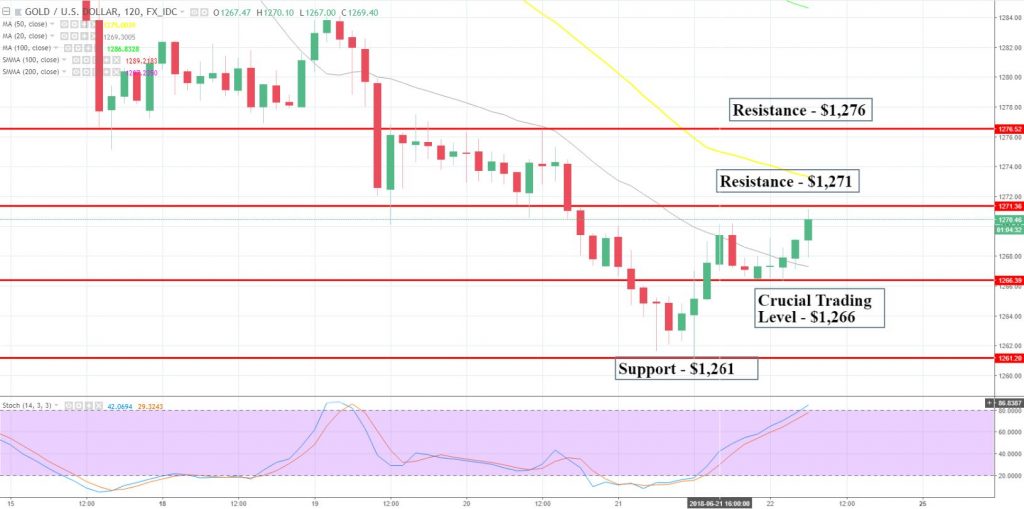
The technical side hasn’t changed much as gold prices are still consolidating in the trading range of $1,261 – $1,271. On the 120 Min chart, gold has crossed above 20 periods moving average at $1,267 and is heading towards the 50 periods EMA at $1,273.
On the way, gold has to face a strong horizontal resistance level of $1,271. Traders, it’s the same level which was working as a support on Monday and was violated on June 20.

Gold – 120 Min Chart
At the moment, gold seems to form a rejection candle below $1,271, the support becomes resistance level which is a pretty strong sign of bearish sentiment of investors. But we can’t ignore the fact that the rejection candle can also be a result of thin trading volume.
The economic calendar isn’t offering us any major events from the United States. But, it will be interesting to trade the Canadian inflation figures later today. Bear in mind that the Canadian economic events don’t have a direct correlation with gold. Thus I’m not expecting any movement in gold on the release of Canadian CPI. Check out FX Leaders June 22 – Economic Events Report for handy information.
Gold – XAU/USD – Key Trading Levels
Support Resistance
1264.81 1271.53
1262.73 1273.61
1259.37 1276.97
Key Trading Level: 1268.17
- Check out our free forex signals
- Follow the top economic events on FX Leaders economic calendar
- Trade better, discover more Forex Trading Strategies
- Open a FREE Trading Account


