Gold consolidates above $1,242 – Is it good time to go long?
Today on Monday, the gold prices recovered from a seven-month low on after slow GDP data from China. The greenback has been a prime mover...

Today, the gold prices recovered from a seven-month low after slow GDP data from China. The Greenback has been a prime mover of gold prices as investor focus stays on U.S. retail sales as well as Trump – Putin Summit today. Here’s an update on our gold trading signal…
Gold -XAU/USD – Fundamental Outlook
Just like the dollar, gold is also under the spotlight. As discussed in FX Leaders’ July 16 – Economic Event’s Outlook, the U.S. President Donald Trump, and his Russian counterpart Vladimir Putin will meet in Helsinki for the first designated meeting. The level of uncertainty remains at a peak as the agenda of the meeting isn’t clear. Therefore, the investors seem to hold their positions in gold in order to benefit sudden safe-haven appeal.
In addition, the U.S. earnings reports are also keeping the trading volume in check. Better than expected earnings reports may cause a sell-off in gold and anything worse can cause investors to buy up more gold.
Gold -XAU/USD – Technical Outlook
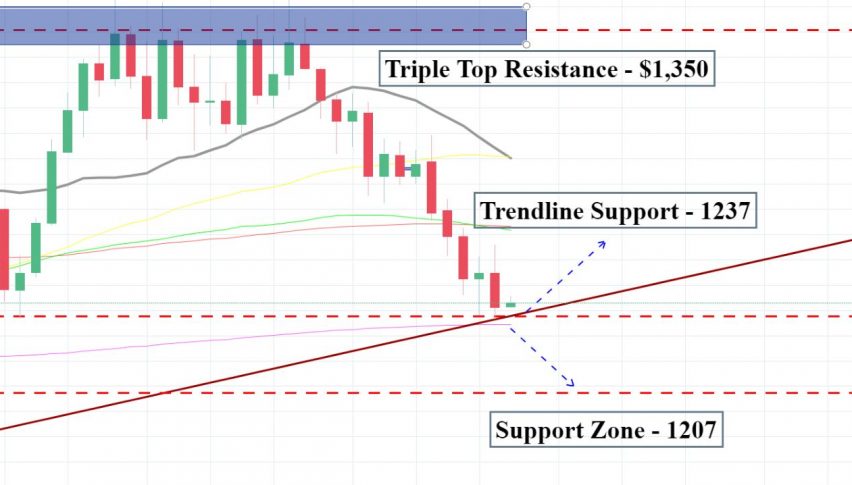
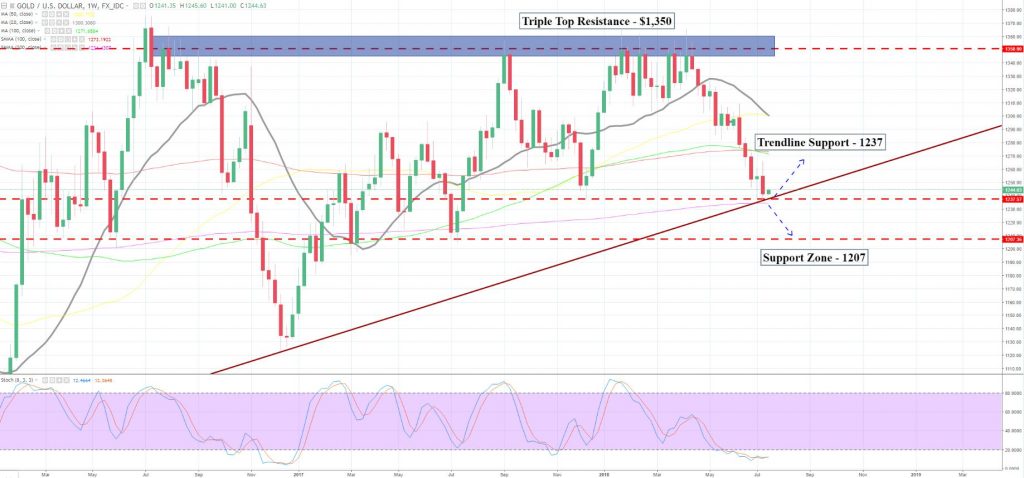
The trading in gold is very slow lately as the price is stuck in a tight trading range $1,241 – $1,247. On the lower side, gold is facing strong support near $1,237. It’s the trendline and 200 periods moving average which is supporting gold near $1,237.

On the upper side, $1,247/48 is likely to extend hurdle. The violation of $1,248 can lead gold prices towards $1,252.
Gold – XAU/USD – Trade Idea
During the ending hours of the Asian session, we opened a buying signal above $1,243 with a stop below $1,240 and a target of $1,247. Good luck!
- Check out our free forex signals
- Follow the top economic events on FX Leaders economic calendar
- Trade better, discover more Forex Trading Strategies
- Open a FREE Trading Account


