EUR/JPY Trading In Ascending Triangle Pattern – Buckle Up for Breakout!
Taking a quick look on the hourly chart of EUR/JPY, the pair is consolidating right below the triple top resistance level of 126.350...
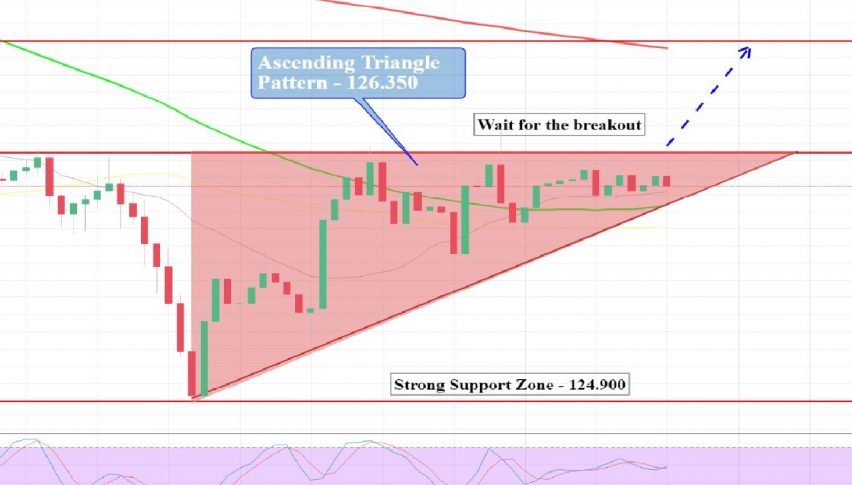
Taking a quick look at the hourly chart of EUR/JPY, the pair is consolidating right below the triple top resistance level of 126.350. Actually, it’s an ascending triangle pattern which at first is representing the neutral sentiment of traders. It’s clearly showing the indecision among traders. Perhaps, they are waiting for some European CPI data to determine their next move.
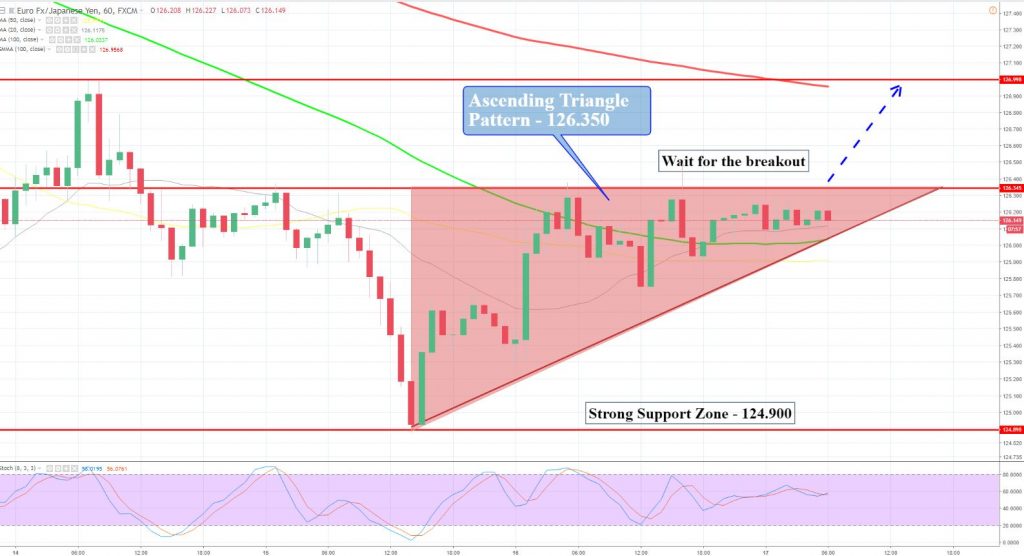
Secondly, it’s an ascending triangle pattern and typically this type of pattern breaks upward. If that happens, I will be looking to take a buying position above 126.500 to target 127. While the pair can stay bearish below 126.500 today. Investors are advised to see FX Leaders Aug 17 – Economic Events Outlook for more details on the economic events and expectations. Good luck!
- Check out our free forex signals
- Follow the top economic events on FX Leaders economic calendar
- Trade better, discover more Forex Trading Strategies
- Open a FREE Trading Account