Gold Trading Signal – Symmetric triangle breakout doing well!
The precious metal gold has come out of the symmetric triangle pattern on better than expected GDP data. The U.S. gross domestic product...
•
Last updated: Thursday, August 30, 2018
The precious metal gold has come out of the symmetric triangle pattern on better than expected GDP data. The US gross domestic product rose at a 4.2% annualized rate, as the Commerce Department data showed in its second estimate of GDP growth for the second quarter. That was slightly up from the 4.1% growth rate reported in July.
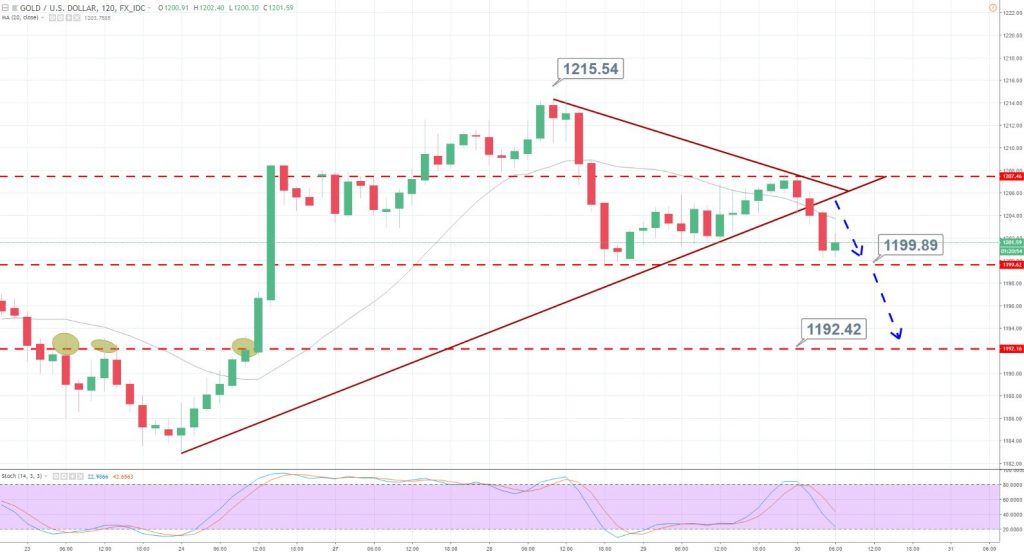
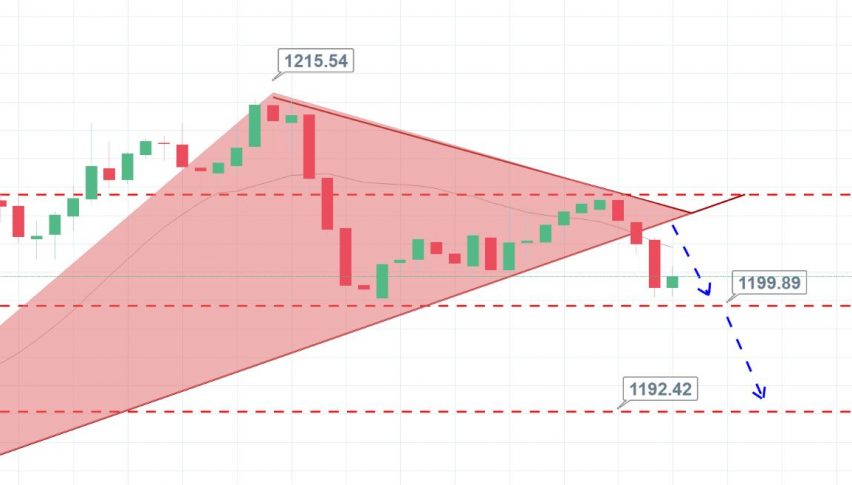
Gold – 2 Hour Chart
On the 2 – hour chart, gold was trading in a symmetric triangle pattern which supported it near $1204. At present, the same level is working as a resistance and the market can go after $1,199. Overall, gold’s short-term technical outlook is bearish as the RSI and moving averages are suggesting a bearish bias of traders.
Our forex trading signal is to sell below $1,203 to target $1,200.50. Good luck.
- Check out our free forex signals
- Follow the top economic events on FX Leaders economic calendar
- Trade better, discover more Forex Trading Strategies
- Open a FREE Trading Account
ABOUT THE AUTHOR
See More
Arslan Butt
Lead Markets Analyst – Multi-Asset (FX, Commodities, Crypto)
Arslan Butt serves as the Lead Commodities and Indices Analyst, bringing a wealth of expertise to the field. With an MBA in Behavioral Finance and active progress towards a Ph.D., Arslan possesses a deep understanding of market dynamics.
His professional journey includes a significant role as a senior analyst at a leading brokerage firm, complementing his extensive experience as a market analyst and day trader. Adept in educating others, Arslan has a commendable track record as an instructor and public speaker.
His incisive analyses, particularly within the realms of cryptocurrency and forex markets, are showcased across esteemed financial publications such as ForexCrunch, InsideBitcoins, and EconomyWatch, solidifying his reputation in the financial community.


