Finally the Uptrend Takes Form in Bitcoin
Bitcoin has been trading in a tight range for quite a few months and now it is bouncing off the bottom of the range.
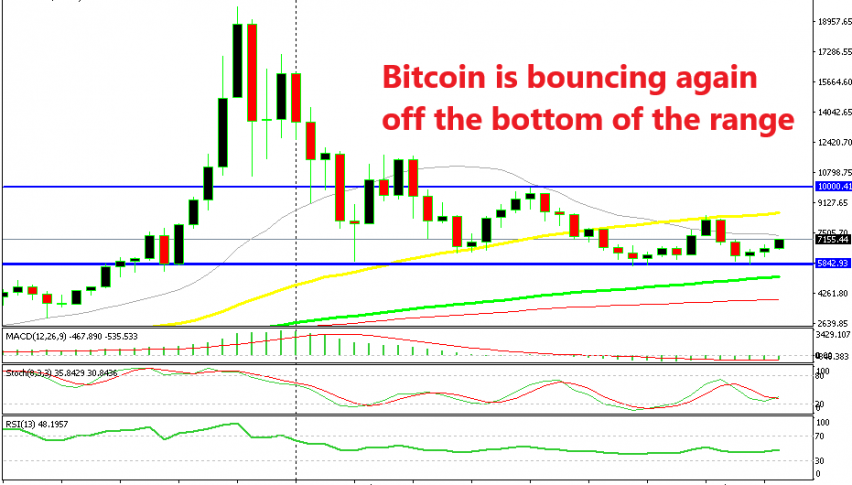
Bitcoin has been trading in a tight range for quite a few months. The range has been defined by the $10,000 level at the top and the support at the bottom which stands just below the $6,000 level. The range is not exactly narrow, but it looks so considering the price action we have seen late last year and yearly this year. The range is getting narrower though, since tops have been declining starting back in March this year, as the weekly chart above tells us.
Although, now Bitcoin is in the bullish phase. We reached the bottom of the range a few weeks ago where Bitcoin bottomed out below the $6,000 level. The support area held once again and Bitcoin started reversing up from there. Although, I wasn’t sure about the reverse in the first two weeks even though we saw a doji three weeks ago above the support, which is a strong reversing indicator. I wasn’t sure because the previous two weekly candlesticks were pretty small, despite closing higher. This week the trend has taken form; the stochastic is turning higher and the price is above the $7,000 level.
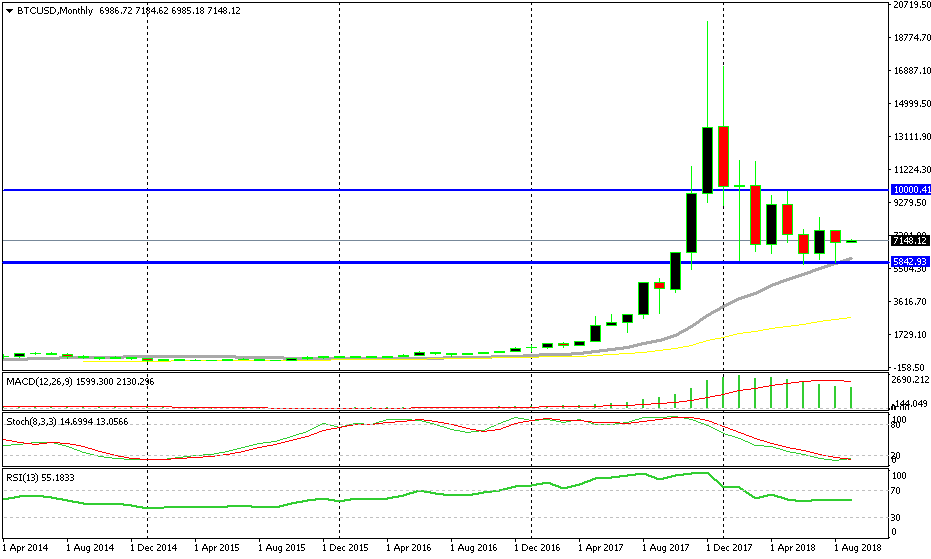
The 20 SMA finally caught up with the price and it provided support immediately
Although, as you can see from the monthly chart above, the odds of a reversal were pretty high since the 20 SMA (grey) caught up with the price last month in August. So, this was another sign for the reversal that we are seeing on the weekly Bitcoin chart. On the monthly chart, the picture is even more bullish. Here, the trend is still up and the decline of the last 8 months is just a retrace of this uptrend. Now, stochastic is oversold, which means that the bullish trend will resume soon and probably break last year’s high, although it is too early to tell, so let’s just stick to smaller time-frame charts.
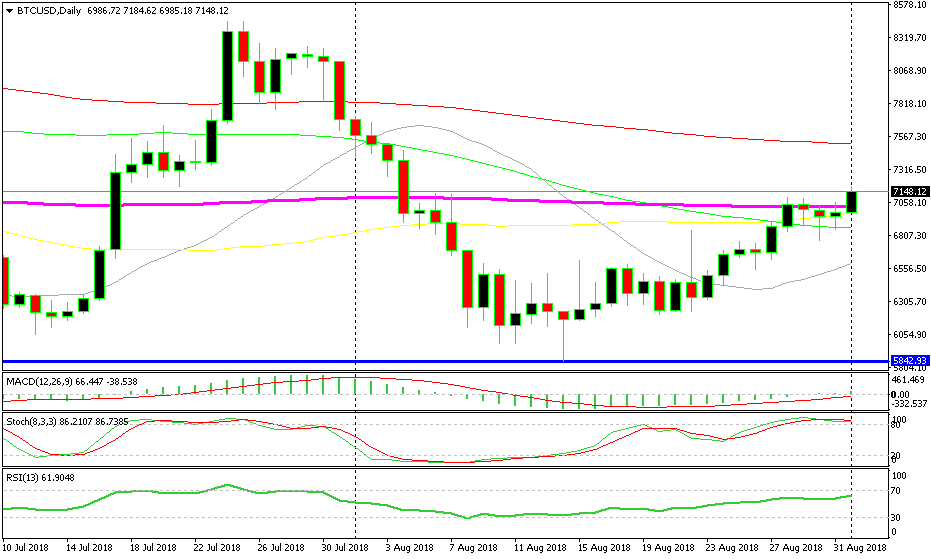
The 200 SMA finally got broken
Speaking of smaller time-frame charts, let’s scale down to the daily chart. On this chart, we see that Bitcoin reversed right after touching the support levels at $5,850 sometime by mid August. It had difficulties overcoming the 200 SMA (purple) as it found strong resistance for several days, but yesterday the price broke above this moving average. This is another strong signal that Bitcoin is on a bullish run at the moment. The buyers are in control and they didn’t get disheartened by the failure to break the 200 SMA for several days. This sort of price action clearly points up.
We have a long term buy forex signal in Bitcoin which we opened during the bearish move. That signal looks pretty good right now so we will let it run for some time. I would like to see Bitcoin reach at least $10,000 this time, but the last reverse took place somewhere around $8,400, so we will see first how the price reacts around this level. If it overcomes it without much hassle, then we will let it run for $10,000.
- Check out our free forex signals
- Follow the top economic events on FX Leaders economic calendar
- Trade better, discover more Forex Trading Strategies
- Open a FREE Trading Account
- Read our latest reviews on: Avatrade, Exness, HFM and XM
Related Articles

Sidebar rates
Related Posts
