Crossover in BTC/USD – How far it can go?
BTC/USD, the leader of cryptocurrencies, just had a breakout on the technical pattern which looks like an ascending triangle pattern....
•
Last updated: Friday, September 14, 2018

BTC/USD, the leader of cryptocurrencies, just had a breakout on the technical pattern which looks like an ascending triangle pattern. As you can see on the 4- hour chart below, the BTC/USD was facing a resistance near $6,515 along with a support near $6,420. That $6,515 was also a double top level but the traders have violated the level. So what’s next?
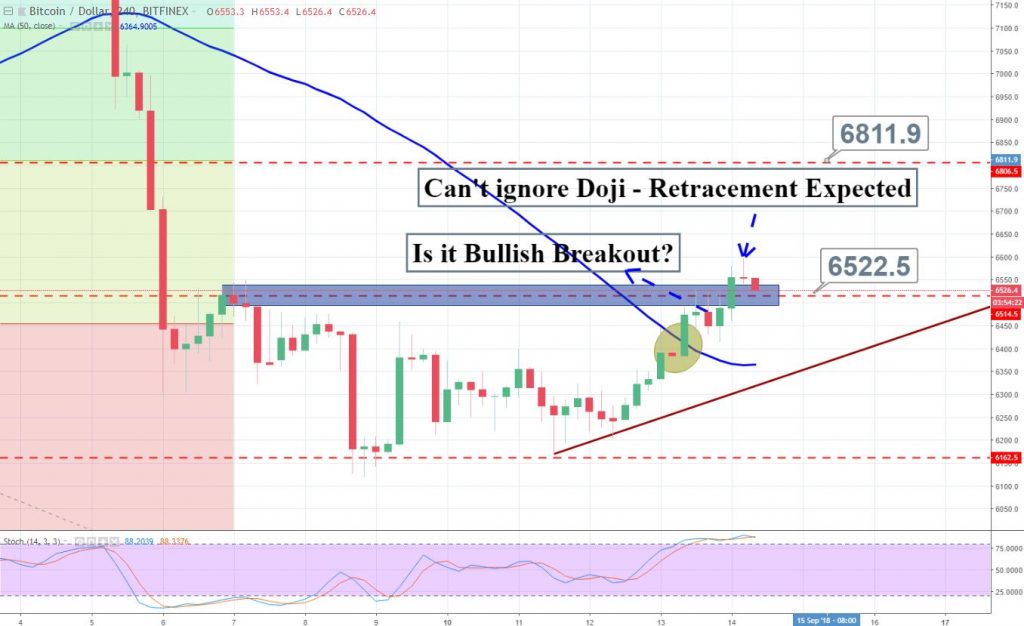
Technically, the pair can continue its bullish momentum only if it manages to hold above $6,500. Bitcoin can extend a bullish rally to the next target level of $6,800. Whereas, the BTC/USD can drop to $6,410 on the violation of $6500 support.
The 50 – periods EMA crossover and the RSI are also supporting the bullish trend. Good luck!
- Check out our free forex signals
- Follow the top economic events on FX Leaders economic calendar
- Trade better, discover more Forex Trading Strategies
- Open a FREE Trading Account
ABOUT THE AUTHOR
See More
Arslan Butt
Lead Markets Analyst – Multi-Asset (FX, Commodities, Crypto)
Arslan Butt serves as the Lead Commodities and Indices Analyst, bringing a wealth of expertise to the field. With an MBA in Behavioral Finance and active progress towards a Ph.D., Arslan possesses a deep understanding of market dynamics.
His professional journey includes a significant role as a senior analyst at a leading brokerage firm, complementing his extensive experience as a market analyst and day trader. Adept in educating others, Arslan has a commendable track record as an instructor and public speaker.
His incisive analyses, particularly within the realms of cryptocurrency and forex markets, are showcased across esteemed financial publications such as ForexCrunch, InsideBitcoins, and EconomyWatch, solidifying his reputation in the financial community.