Bitcoin Forms a Bearish Reversing Chart Setup


Bitcoin has been on a major downtrend since late last year after it failed to break the $20,000 level. Although, the area around the $6,000 level has been holding the line for Bitcoin buyers as it has provided support many times in recent months.
Last week was the most recent time that this area provided support for Bitcoin as this cryptocurrency reversed from there and climbed above $6,800 by Saturday.
But, it seems as Bitcoin sellers have taken control once again as they are trying to reverse it back down from here. This would be a pretty lame attempt from buyers having pushed up less than $1,000 as Bitcoin bounced from $6,000. But, the highs have been getting lower so this might be the beginning of a real reversal.
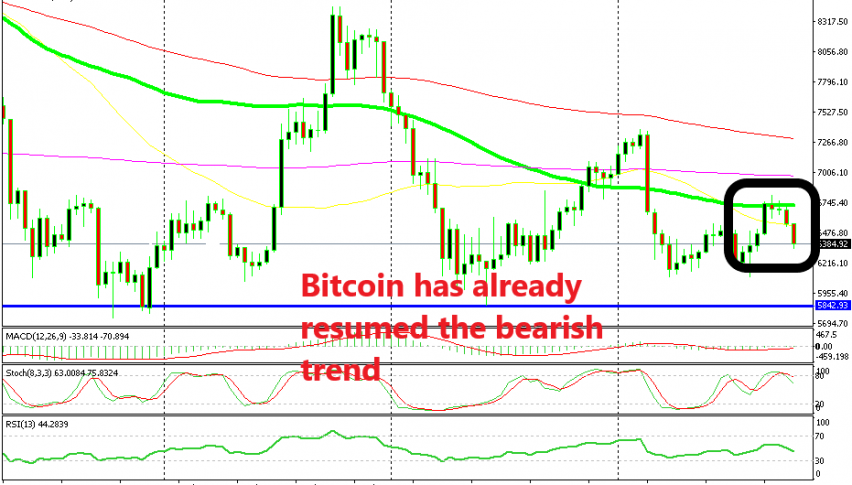
As you can see from the daily chart above, Bitcoin found solid resistance at the 100 SMA (green) in the last few days. The daily candlesticks formed a doji on Saturday and a smaller one yesterday which are reversing signals.
Today, the candlestick looks pretty bearish so far, so the bearish reverse might have already started. The stochastic indicator is overbought which is another reversing sign and it is turning lower as well. Technically it looks bearish now, but it is too early to tell. Let’s see if the $6,000 level will hold again or whether it will be broken this time.