DAX Bounces Off the 50 SMA on the Monthly Chart Once Again
DAX has been retracing lower with other major indices on deteriorating market sentiment. But they might have reached a bottom for now
Stock markets have taken a major beating in the last few weeks if you look at the daily chart. Brexit seems to be heading towards a dead-end while the EU s set to reject the Italian budget for next year, which have hurt the sentiment and sent the stock markets tumbling lower as a result.
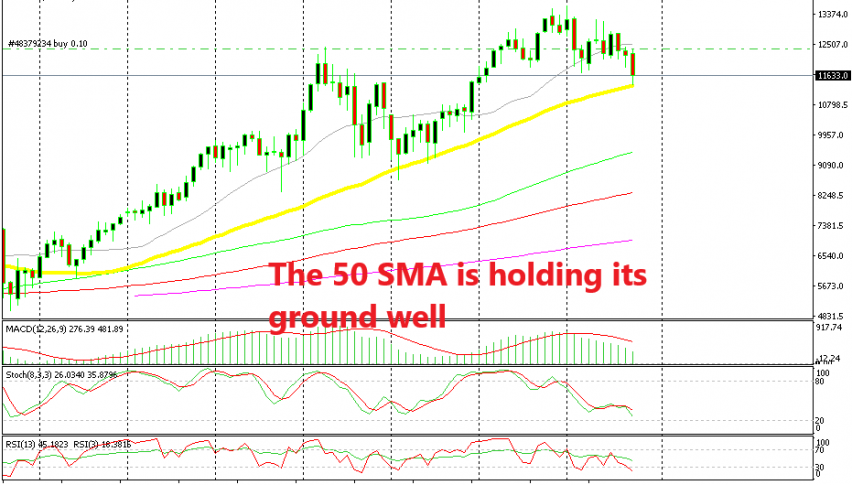
But, looking at the monthly chart, this decline looks just like a normal retrace. DAX has made similar pullbacks before, so this retrace is nothing out of the ordinary. As we have mentioned before, the smaller period moving averages come into play when the trends are strong, so the 20 SMA (grey) has been providing support for DAX when the uptrend was strong.
When the bullish trend became softer, DAX has found support on the 50 SMA (yellow). This is one of those times when the uptrend slows down and the 50 SMA comes into play.
As you see from the main chart in this forex update, DAX has touched the 50 SMA as it slipped to 11,400 at the end of last week. But, the price couldn’t break below the 50 SMA and it pulled back up after touching it.
The stochastic indicator is also nearly oversold on the monthly chart. By next week, stochastic will be oversold and the fundamental picture will be a bit clearer, so I think that we should wait until next week. If the market sentiment improves, then we might open a long term buy signal in DAX, since the technical analysis agrees with that trade.
- Check out our free forex signals
- Follow the top economic events on FX Leaders economic calendar
- Trade better, discover more Forex Trading Strategies
- Open a FREE Trading Account
- Read our latest reviews on: Avatrade, Exness, HFM and XM
Related Articles


Sidebar rates
Related Posts
