Planning A Long-Term Trade on Oil As It Heads for the 200 SMA on A Long-Term Uptrend
Crude Oil has been on a strong uptrend in the last year or so, climbing around $34 in the process. The pickup in the global economy and, more importantly, sanctions on Iran and Venezuela, and the OPEC price manipulation have contributed to this increase in oil prices fundamentally.
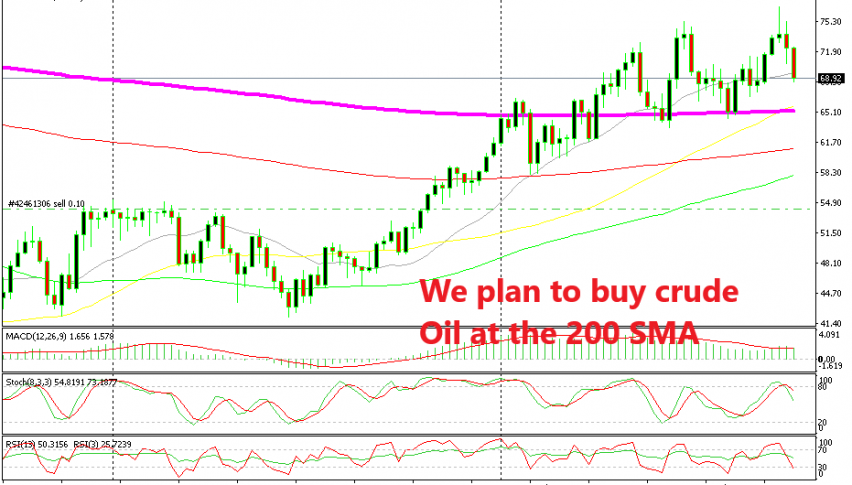
On the way up, WTI Crude Oil found resistance at the 200 SMA (purple) on the weekly chart. Eventually, Oil broke above this moving average and now it has turned into support, as these horizontal levels usually do.
This moving average provided support in June and again in August after the bearish reversal in July. By the way, that bearish reversal looks very similar to the chart setup that we have seen in the last three weeks.
As you can see from the weekly chart at the top of this update, WTI Crude Oil formed a doji two weeks ago, pretty similar to the one back in July. That is a bearish reversal candlestick. Then, that doji was followed by two bearish candlesticks which reinforce the bearish reversal chart setup.
So, Oil is following a bearish momentum now and it has lost around $7 so far. But there is still some more room for sellers to use. Oil can still fall another $4 until it reaches the 200 SMA. By that time, the stochastic indicator will be oversold and this bearish pullback will be complete.
The Plan
- Wait for the retrace to complete when Oil reaches the 200 SMA
- Look for signs of weakness from sellers when we get there
- Get a reversal confirmation such as a pin, doji or hammer candlestick
- See that the fundamentals turn/are bullish (positive market sentiment)
- Open a buy position with a stop below the 200 SMA, but not to close
When the WTI Crude Oil reaches the 200 SMA, the stochastic indicator should be oversold. If the sentiment turns positive and we get a technical signal (see no. 3), then we should start thinking about going long on Oil with a long-term trade.


