Descending Triangle Pattern In Crude Oil – Saudi Arabia Warns of Oversupply!
Crude oil is trading near the 50% Fibonacci retracement level which is extending a solid resistance to oil near $67. The same level is...
The WTI crude oil continues to trade bearish, falling more than 1% during the early Asian session. The black gold is heading for a third weekly loss after Saudi Arabia warned of oversupply, while a drop in stock markets and anxieties around trade clouded the outlook for fuel demand.
WTI Crude Oil – Technical Outlook
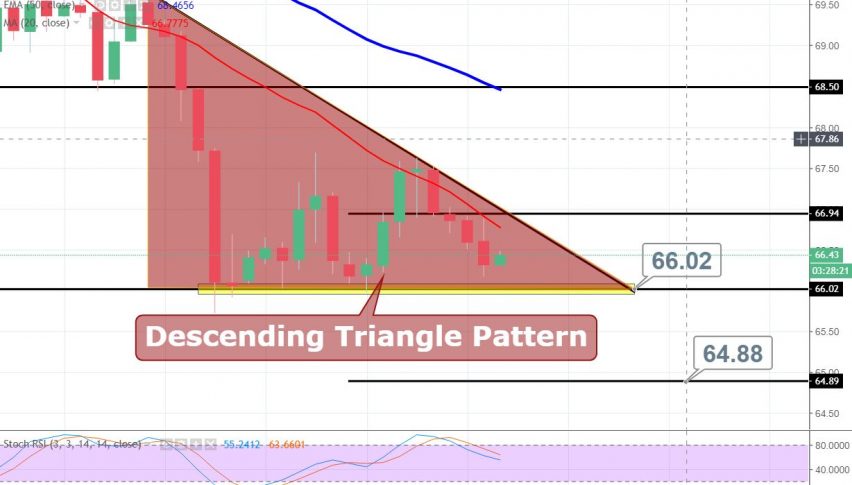
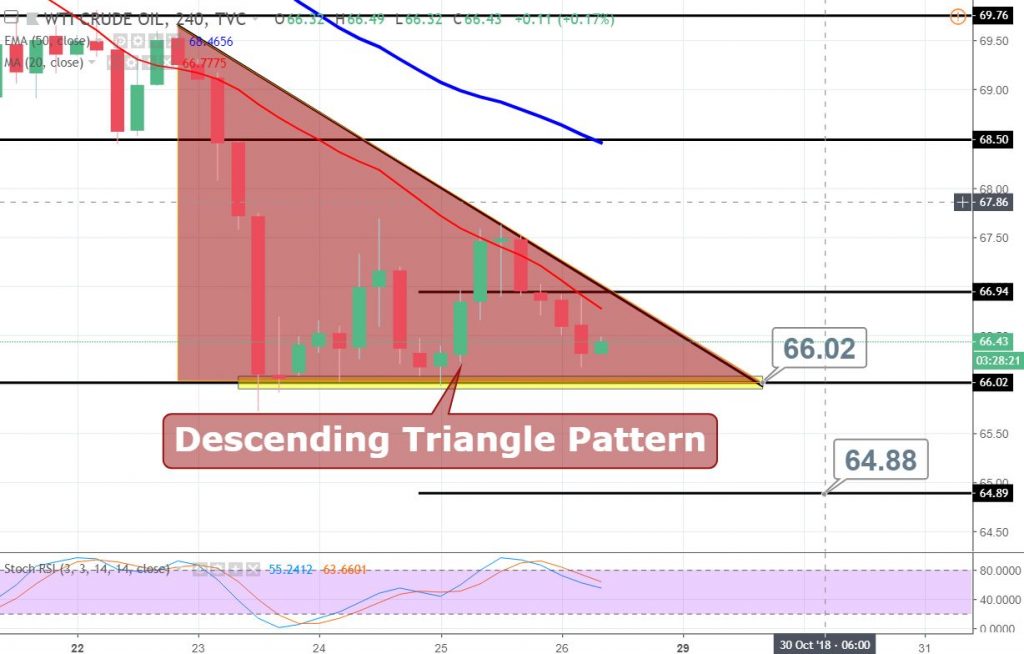
At the moment, crude oil is trading near the 50% Fibonacci retracement level which is extending a solid resistance to oil near $67. The same level is also important because 50 – periods exponential moving average is extending resistance at $67. There’s a descending triangle pattern which is supporting the black crack above $66 and the violation of this level this level can lead oil prices towards $64.85.
Support Resistance
66.14 67.76
65.29 68.52
63.67 70.14
Key Trading Level: 66.91
It will be nice to stay bearish below $67 to target 50 pips, while bullish seems to loom around $66. Good luck!
- Check out our free forex signals
- Follow the top economic events on FX Leaders economic calendar
- Trade better, discover more Forex Trading Strategies
- Open a FREE Trading Account
- Read our latest reviews on: Avatrade, Exness, HFM and XM
Related Articles


Sidebar rates
Related Posts
