The 20 SMA to Turn Into Support for GBP/USD Now?
GBP/USD has been on a steep uptrend recently. But, the Brexit optimism of two weeks ago is diminishing and traders are looking at the down..

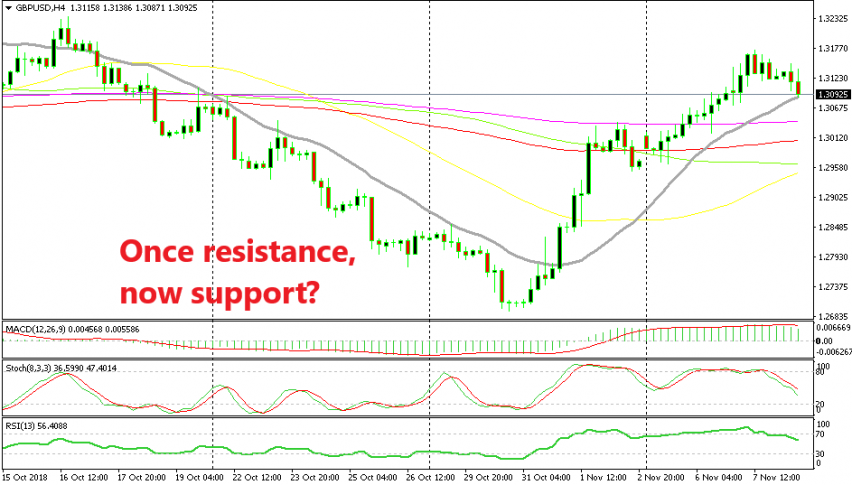
[[GBP/USD]] used to trade on a steady downtrend during most of October. That bearish trend was pretty straightforward; every retrace higher ended at the 20 SMA (grey) on the H4 chart, where the sellers jumped in and forced this pair resume the downtrend.
But, news about a possible Brexit deal in late October reversed the sentiment for the GBP and this forex pair shifted the trend. In fact, the bullish reversal happened pretty quickly and the uptrend that followed was quite steep.
GBP/USD broke all moving averages and resistance levels without much of a trouble since a Brexit deal would change the fundamental picture completely for the GBP. During this time GBP/USD climbed nearly 500 pips.
But, the market is getting used to the Brexit comments and, right now, we are where we were a few weeks ago, everything agreed between EU and UK apart from the Irish border issue. So, the optimism has worn out now but traders are still holding their breath for a possible deal soon – that’s the reason this pair hasn’t resumed the bearish trend just yet.
GBP/USD has slipped lower in the last few sessions and now it is facing the 20 SMA, but this time the price is coming at it from the upside. This moving average was a pretty strong resistance indicator as we said, so it is now expected to turn into support. It faced the first trial just a while ago and it resisted well.
If this moving average resists now, then we might see GBP/USD hold around these levels for some time or even make another bullish leap higher, otherwise it is bound to turn bearish if the 20 SMA gets broken. But, as usual with this pair, keep an ear on comments from UK, EU and Ireland as well.
- Check out our free forex signals
- Follow the top economic events on FX Leaders economic calendar
- Trade better, discover more Forex Trading Strategies
- Open a FREE Trading Account


