NZD/USD Peaking out of Triangle Pattern – Long Term Trading Signal
The NZD/USD is trading at $0.6810 and it's likely to stay supported above $0.6795. On the upper side, the resistance can be found at $0.6890
•
Last updated: Thursday, November 15, 2018

What’s up, traders?
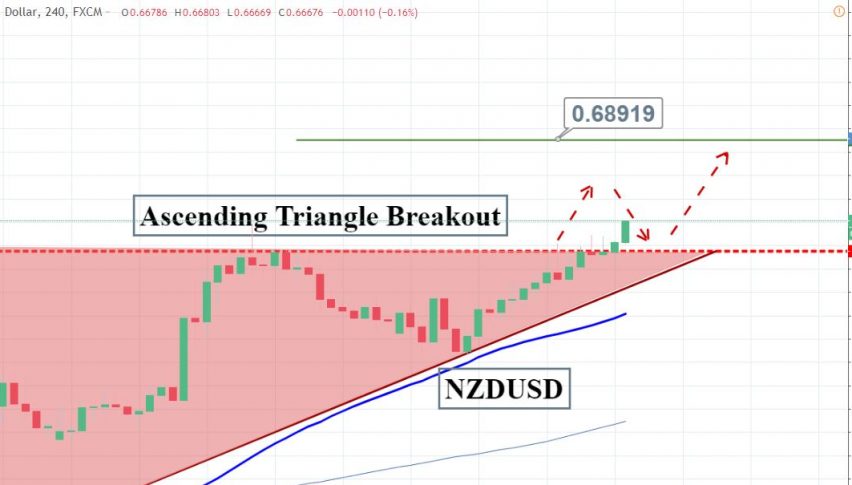
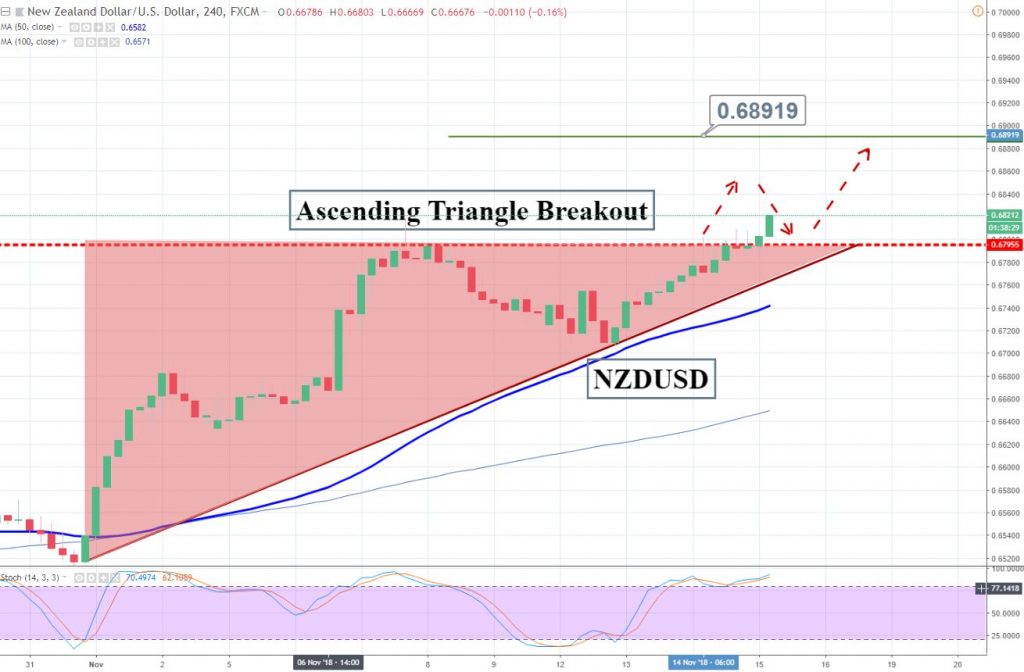
As you know the dollar is trading bearish, following news that China passed a written response to US trade demand, and that the two nations reopened talks earlier this week to diffuse their trade disputes. In response, the NZD/USD has come out of the ascending triangle pattern which can be seen on the 2-hour chart.

- The triangle pattern was providing a solid resistance to NZD/USD near $0.6795 which is now violated. The market is trading outside of the triangle which is a bullish sign for traders.
- At the moment, the NZD/USD is trading at $0.6810 and it’s likely to stay supported above $0.6795. On the upper side, the resistance can be found at $0.6890.
- The RSI and Stochastics are trading in the buying zone (above 50), signaling a buying sentiment of traders.
- Lastly, the pair is trading above 20 and 50 periods EMA, which signifies a bullish trend of the pair.
NZD/USD – Swing Trade
We just opened a long-term forex trading signal on NZD/USD to go long above $0.6810 with a stop below $0.6775 and a take profit at $0.68795. I will be looking to move my stop loss at the breakeven point as soon as the market soars 50 pips.
Good luck!
- Check out our free forex signals
- Follow the top economic events on FX Leaders economic calendar
- Trade better, discover more Forex Trading Strategies
- Open a FREE Trading Account
ABOUT THE AUTHOR
See More
Arslan Butt
Lead Markets Analyst – Multi-Asset (FX, Commodities, Crypto)
Arslan Butt serves as the Lead Commodities and Indices Analyst, bringing a wealth of expertise to the field. With an MBA in Behavioral Finance and active progress towards a Ph.D., Arslan possesses a deep understanding of market dynamics.
His professional journey includes a significant role as a senior analyst at a leading brokerage firm, complementing his extensive experience as a market analyst and day trader. Adept in educating others, Arslan has a commendable track record as an instructor and public speaker.
His incisive analyses, particularly within the realms of cryptocurrency and forex markets, are showcased across esteemed financial publications such as ForexCrunch, InsideBitcoins, and EconomyWatch, solidifying his reputation in the financial community.


