Bitcoin Continues to Crash- Is BTC/USD Going After $5000?
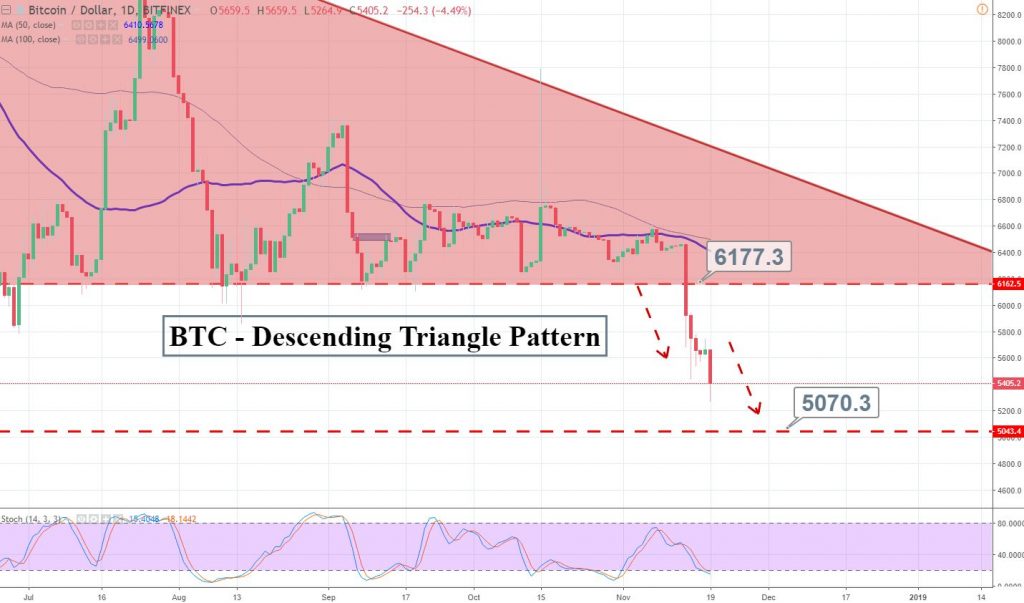
The BTC/USD traded in a descending triangle pattern which provided it with a solid support at $6,160 and a resistance at $6,600. The 20..
On Monday, Bitcoin collapsed to a new 13-month low, with the biggest cryptocurrency touching $5264.9 on the Bitfinex. The bearish rally doesn’t seem like it would stop until it tests $5,000.
Earlier, BTC/USD traded in a descending triangle pattern which provided it with a solid support at $6,160 and a resistance at $6,600. The 20 & 50 periods moving averages kept it in a bearish trend and then the crypto finally broke downward.
Support Resistance
5027.82 6209.65
4524.13 6887.79
3342.3 8069.62
Key Trading Level: 5705.96
Bitcoin gave an intra-day close below $6,100 to confirm a bearish breakout. The pair is trading sharply bearish to target $5,000. The bearish engulfing, three black crows and the RSI below 50 are signifying a strong bearish bias of traders.
- Check out our free forex signals
- Follow the top economic events on FX Leaders economic calendar
- Trade better, discover more Forex Trading Strategies
- Open a FREE Trading Account