Gold Finding Support at Moving Averages
Gold is finding support at moving averages below, but it can't push above the resistance either.

Gold has attracted some strong bids in the last two weeks as the sentiment turned negative. The demand for safe havens increased which is displayed in USD/JPY. This forex pair has lost around 200 pips during this time as the JPY has become stronger.
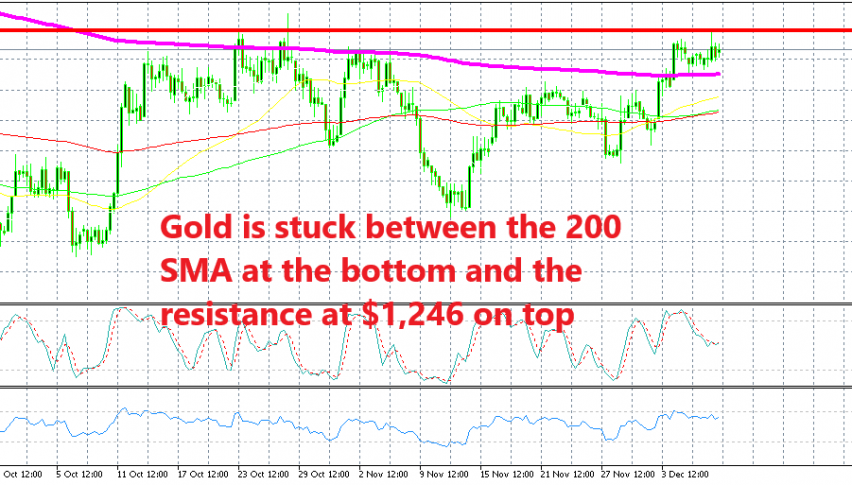
The last week in particular has been great for Gold. Last week, it was banging its head against the 200 SMA (purple) on the H4 chart. That moving average had been providing resistance for Gold for two months, since the beginning of October.
That’s the reason we decided to go short on Gold. Gold was overbought at that time and the 200 SMA looked pretty strong. But, Gold buyers managed to push above it for the first time in a long time as the sentiment deteriorated further this week.
Now, that moving average has turned into support as you can see from the H4 chart above. Although, there is still the resistance level at $1,245-46 in red where Gold found resistance again yesterday.

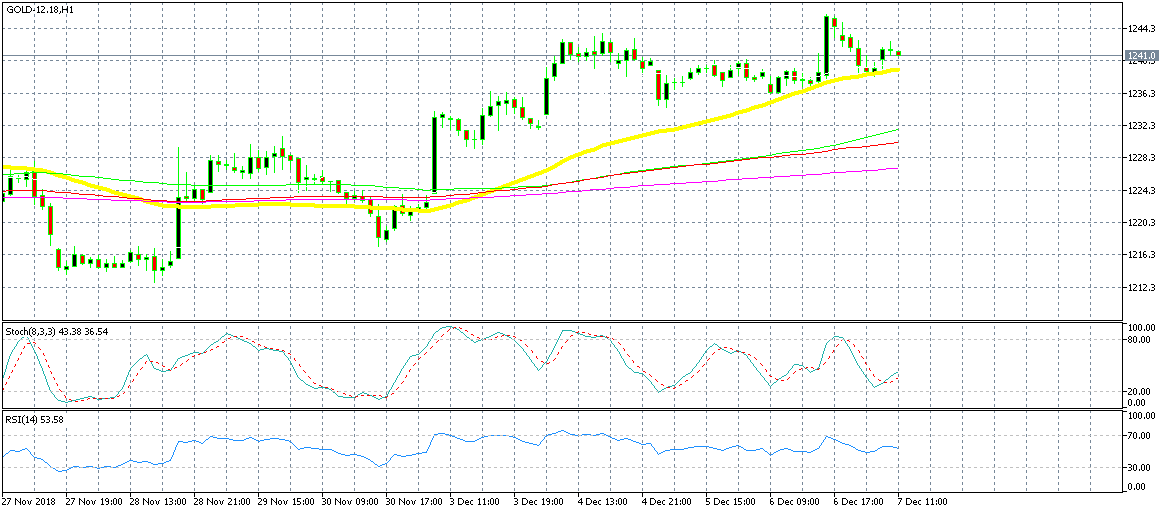
The 50 SMA is providing support on the H1 chart
If we switch to the H1 chart time-frame, we can see that another moving average has been providing support for Gold. The 50 SMA (yellow) provided support yesterday before the last push higher and it has held the price today as Gold slips lower. So, it is this moving average which has to go first and to me it looks in danger.
The longer it takes for the buyers to push higher, the more in danger this moving average is since the sellers will become more confident with time, if the buyers can’t push any higher soon. If this moving average gets broken, then it is the turn of the 200 SMA on the H4 chart, but one step at the time.
- Check out our free forex signals
- Follow the top economic events on FX Leaders economic calendar
- Trade better, discover more Forex Trading Strategies
- Open a FREE Trading Account


