How Bitcoin Told Us It Was Going to Crash Lower
How Bitcoin The decline in cryptocurrencies seems unstoppable no at the end of 2018. Bitcoin has broken all major support levels without much resistance and it keeps threatening new levels every week. A year ago exactly, everyone went crazy for cryptocurrencies and Bitcoin nearly reached $20,000. How times change, huh?
The rush for cryptocurrencies in no over, but don’t rule out another “gold rush”. It’s tough to find reason when people enter the crowd mentality, or better I say the herd mentality.
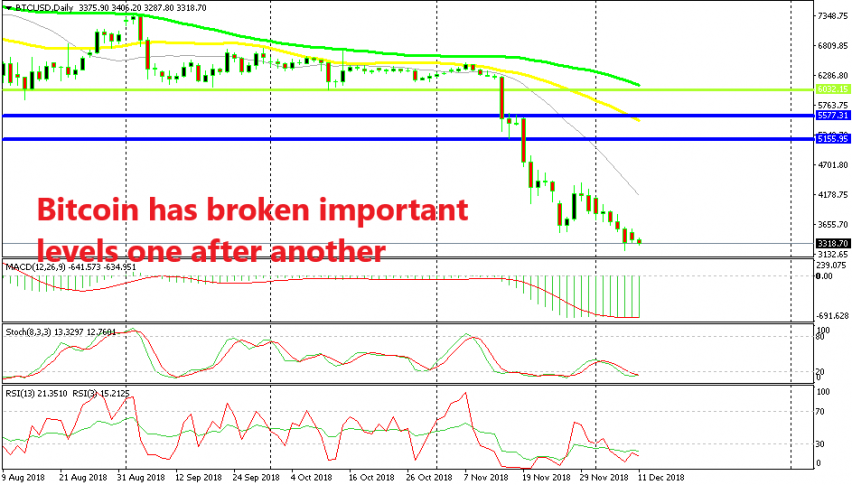
Anyway, Bitcoin broke the $6,000 level first about a month ago. That was a very important level since Bitcoin found support around there on February when the cryptos crashed down after the big blow. That level has been providing support for Bitcoin on many occasions since then.
It formed a big support zone for Bitcoin with a support area which stretched $200 below and above it as these major levels do. So, the market thought that that level would be the bottom for Bitcoin. Bitcoin did bounce many times off of it.
But the bounces were getting smaller all the time and Bitcoin kept coming back to that level increasingly more often. This was a clear indicator that the big support are would go at some point. A triangle formed in the Bitcoin chart as you can see above, with the bottom line at around $6,000 and an ascending trend line.
When such big psychological level gets broken, the decline is set to continue. It got broken. The $5,000 level was another big round psychological level, which Bitcoin buyers had been hoping for to stop the decline. But it broke down pretty easily without much resistance, so that was another sign that the decline was to continue further.
The $4,000 level got broken even faster, so here we are now eyeing the $3,000 level which doesn’t look too far. That’s how you understand that the sellers are in full control, when such major levels start falling like dominoes. Until a further notice, I don’t think anyone will think about buying Bitcoin.


