The 100 SMA Keeping S&P 500 Bearish
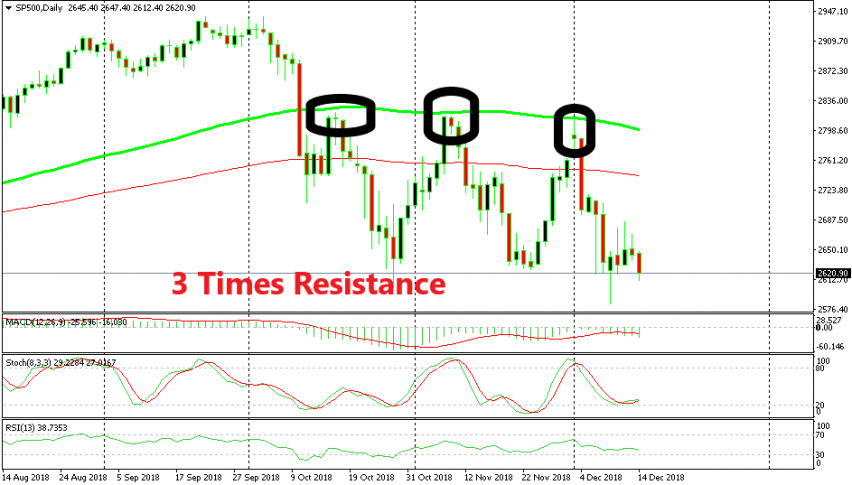
S$P500 turned bearish in October and the 100 SMA has kept it bearish since then.
European stock markets have been mostly bearish this year, especially in the second part as the sentiment turned negative in financial markets. Although US stock markets continued their bullish trend through most of this year, they also turned bearish later.
S&P500 turned bearish at the beginning of October and since then it hasn’t been able to get itself up off the floor. We have seen buyers attempt to reverse the bearish trend, but the 100 SMA didn’t let them. You can see from the daily S&P chart above that buyers tried to push this index above the 100 SMA (green) three times in the last two months, but they failed every time.
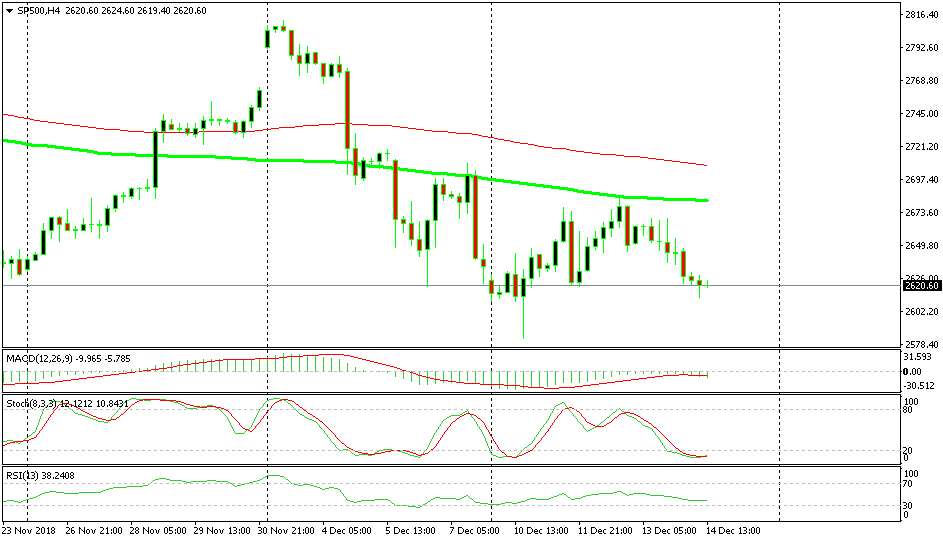
The 100 SMA is working as resistance again on the H4 chart
Switching to the H4 chart, we can see that it is the same moving average which has kept S&P bearish for more than a week. This moving average provided resistance late last week after the price slipped below it. It provided solid resistance again this week.
So, we are thinking of going short on S&P at the 100 SMA when the buyers find the strength to push the price up there again. We will wait for a confirmation that the bullish retrace is over at the 100 SMA and if we get that, then we will short this index.
- Check out our free forex signals
- Follow the top economic events on FX Leaders economic calendar
- Trade better, discover more Forex Trading Strategies
- Open a FREE Trading Account
- Read our latest reviews on: Avatrade, Exness, HFM and XM
Related Articles


Sidebar rates
Related Posts
