Symmetric Triangle in WTI Crude Oil – Technical Outlook
The WTI crude oil prices have moved in between the bearish and bullish trendline of the symmetric triangle pattern which is extending...
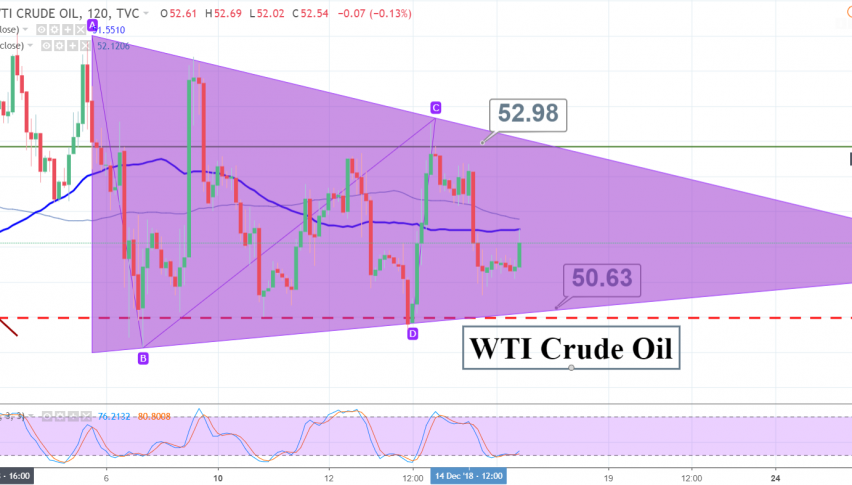
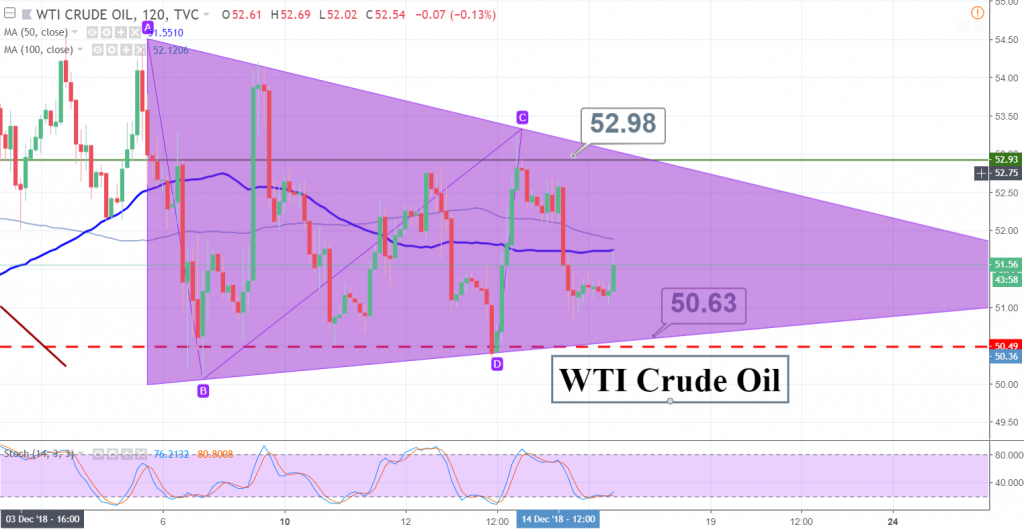
Today, the financial markets are all about technicals analysis. Looking at the 4-hour chart, we can see a very fine trade setup. Crude oil trades in a symmetric triangle pattern which indicates indecision among investors, perhaps due to the lack of relevant fundamentals.
The WTI crude oil prices have moved in between the bearish and bullish trendline of the symmetric triangle pattern which is extending resistance at $52.50 and support at $50.50. The momentum indicators, RSI and Stochastic are trading near 20 in a selling zone, signaling a selling bias in the crude oil prices.
Support Resistance
51.26 54.15
49.47 55.25
46.58 58.14
Key Trading Level: 52.36
WTI Crude Oil – Trade Idea
I’m looking to take a quick sell below $52.45 with a stop above $52.75 and a take profit at $51 and $50.65.
Good luck!
- Check out our free forex signals
- Follow the top economic events on FX Leaders economic calendar
- Trade better, discover more Forex Trading Strategies
- Open a FREE Trading Account


