UK Brent Oil Tries to Reverse the Downtrend but Moving Averages Keep Pushing It Lower
Oil prices have been on a solid uptrend for about two years now and this year it gained even more pace. But, everything reversed in early October and Oil prices started tumbling. They have been declining at a pretty high speed and UK Brent crude Oil has lost nearly $30 in more than two months or about 30% of its value.
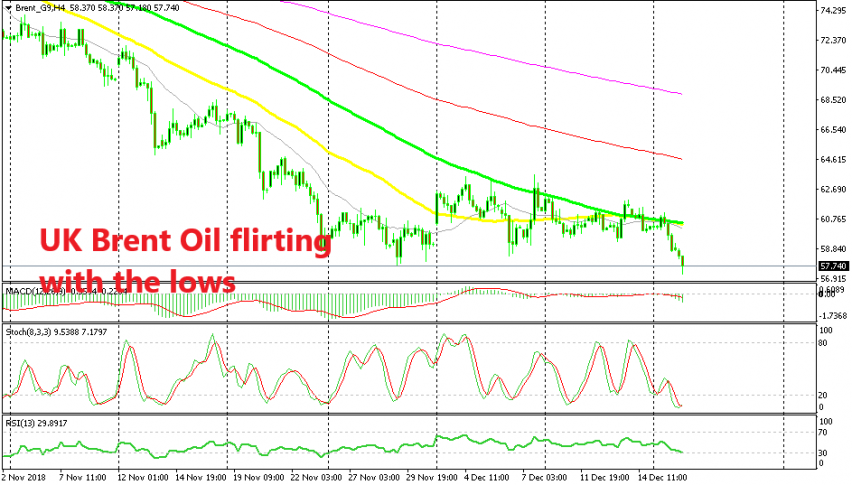
We saw a jump higher more than two weeks ago when OPEC+ countries decided to cut production output by 1.2 million barrels/day. It broke above the 20 SMA (grey) which has been pushing the trend down during November. That shows how strong the trend has been until the end of November. The smaller the moving averages providing support/resistance, the stronger the trend it is. The logic behind this is simple – the buyers/sellers are not waiting for the bigger period moving averages to catch up with the price.
So, the bearish trend has been strong during October and November, but it has stalled this month after the OPEC+ meeting. During December, Crude Oil has traded sidelines mostly, unsure whether OPEC can meet its production cut target. Yesterday we heard that Russia output is at record highs, which is not good for Oil buyers.
UK Brent Crude Oil broke above the 50 SMA yellow two weeks ago and it tried to break the 100 SMA (green) on the H4 chart, but without much success. It provided resistance three times in the first week of December, despite being pierced once on Friday.
Last week, the price action was more quiet but the 100 SMA continued to push Brent Crude Oil lower. It did the same yesterday, so this moving average looks like a good place to sell Brent crude. Although, Oil is trying to break the support level now. It already pierced this year’s lows but has retraced back above the lows, which look in real danger right now.


