Uptrend of Downtrend For Gold?
Gold has been bullish for months, but is that all there is to see? Not if we look at he bigger picture.
If you look at the daily chart of Gold, you can see that Gold has been trading on a bullish trend during the last several months. So, you might wander why we are short on Gold since we have a sell signal live which we opened last week as Gold returned back below the big resistance level at $1,250.
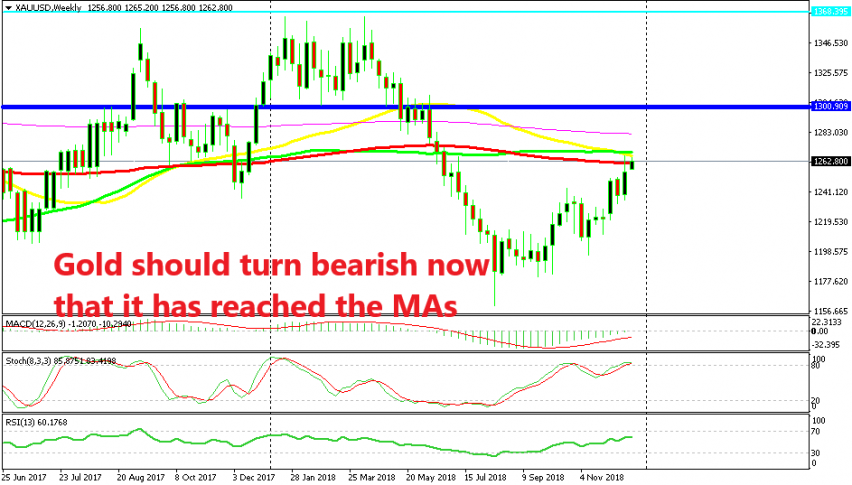
But, if you switch to the larger time-frame charts such as the weekly and monthly, you can see that the bigger trend is still bearish and this latest pullback higher which seems pretty big on the smaller time-frame charts is just a retrace of this bigger downtrend.
We’re taking into consideration the weekly chart and from what we can see there, Gold is just in a retrace mode. It started reversing higher a few months ago after it consolidated for a couple of months. But, the retrace seems complete now.
The stochastic indicator is overbought and the price is running against a confluence of moving averages. The 100 simple (green) and smooth (red) moving averages have provided support and resistance before and it looks like they are providing resistance again now. Besides, we have the 50 SMA (yellow) coming at around $1,266 which is the high so far.
So, we conclude that Gold is still in a downtrend. Will Gold reverse from here and resume the bearish trend? Probably it will. But we will have to wait until after New Year because the market is still running for safe haven assets as we head towards the end of the year.
- Check out our free forex signals
- Follow the top economic events on FX Leaders economic calendar
- Trade better, discover more Forex Trading Strategies
- Open a FREE Trading Account
- Read our latest reviews on: Avatrade, Exness, HFM and XM
Related Articles

Sidebar rates
Related Posts
