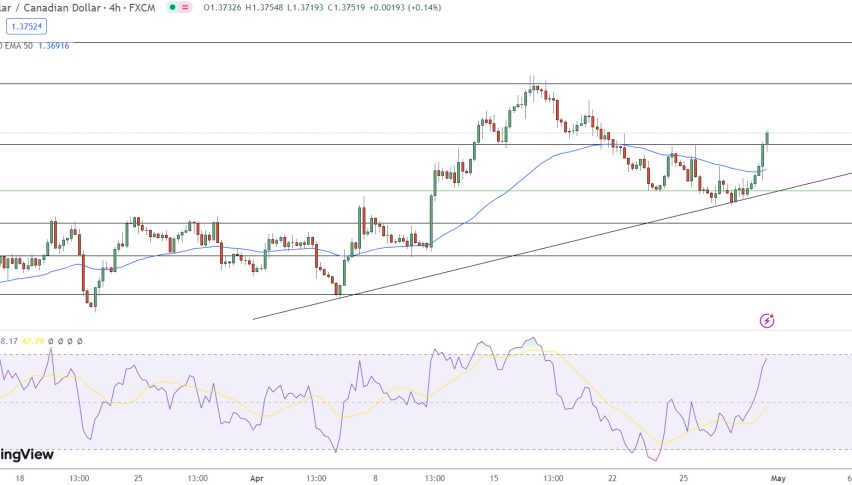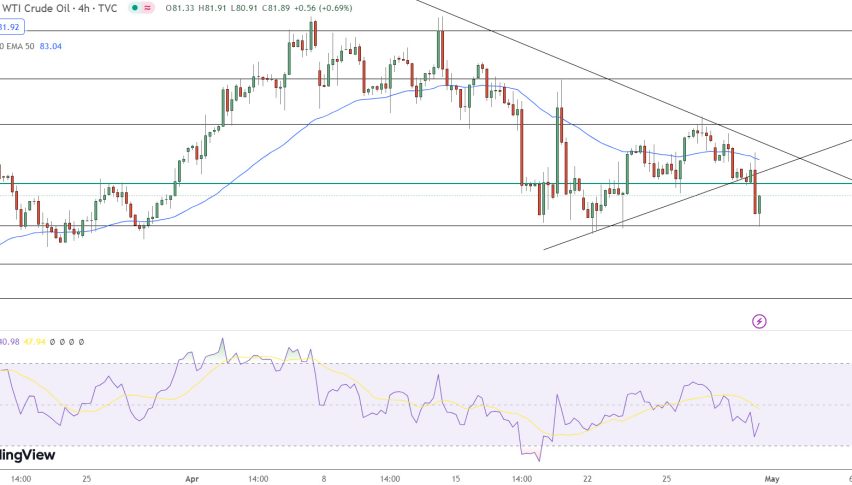


USD/CAD has been on an uptrend for quite some time, but during this month the uptrend has picked up pace considerably. Oil prices have been tumbling with UK Brent crude losing more than $13 from top to bottom this week and that has affected the CAD, sending it lower, thus USD/CAD is moving higher.
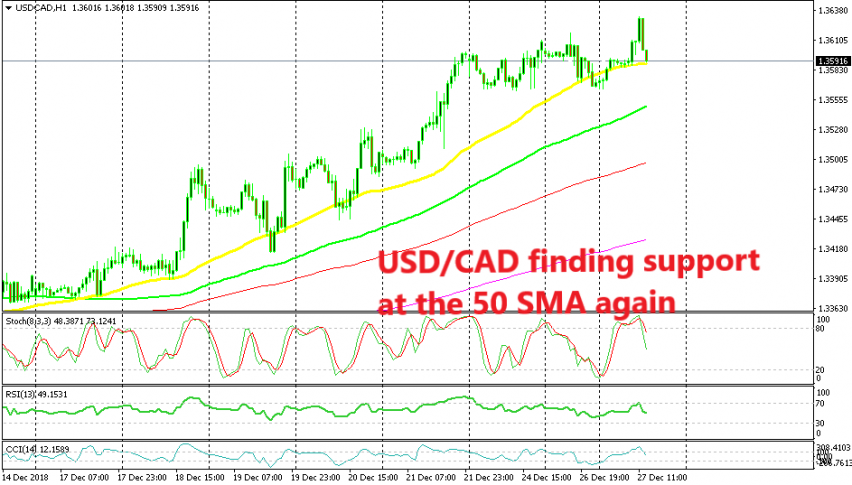
Oil prices rebounded higher yesterday, climbing around $5 but this effect didn’t spill into the CAD. Although, in the last two hours the CAD has gained some strength and USD/CAD has made a bearish reversal lower as you can see from the H1 chart above.
But, we’re still keeping a bullish bias for this pair, so we decided to use this pullback to go long on this forex pair. The trend is pretty bullish and it has only been getting stronger. The fundamentals don’t look too good either with Crude Oil in constant decline.
The 50 SMA (yellow) is also providing support for USD/CAD on the H1 chart and it has been a pretty solid support indicator for this pair during the last two weeks, despite being pierced. The stochastic indicator is not oversold yet, but this chart setup looks great for buyers and we decided to buy right at the 50 SMA. Now let’s hope that this H1 candlestick closes as a pin, which would be a bullish reversing signal and would attract more buyers, thus fulfilling its own prophecy.
Update: USD/CAD reversed higher and hit the take profit target pretty quickly after that H1 candlestick closed as a pin. Cashing in today.