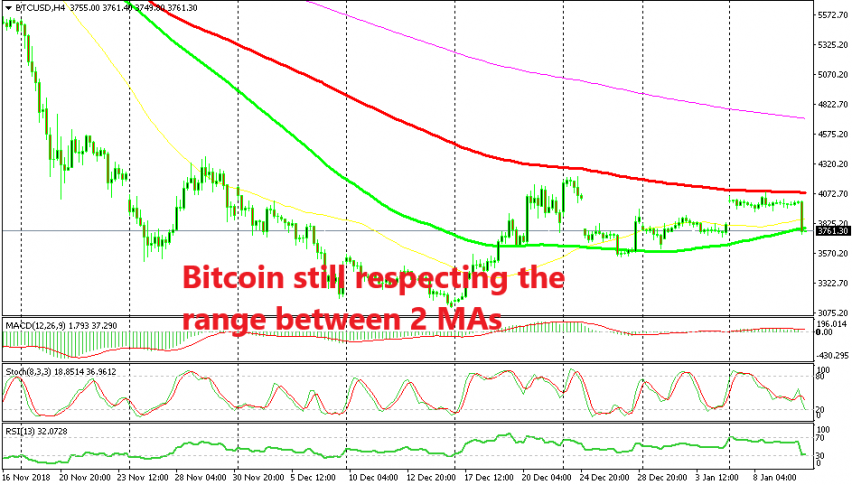
We had a BITCOIN trade which we opened a couple of days ago as this cryptocurrency was banging its head against the 100 smooth moving average (red) on the H4 chart. This moving average comes at around $4,100 and has been providing resistance for several weeks. As you can see from the chart above, it was a great place to open a sell trade/signal around there.
The stochastic indicator was overbought when we opened our Bitcoin signal, so the downside was in favour for the next move in Bitcoin. It didn’t take long and the sellers got active once again. They decided to make a decent move early this morning and Bitcoin declined around $300 in about half an hour.
Bitocin closed the bullish gap which it formed during the weekend. The cryptocurrency market is open during weekends as well so there should’t be gaps, unless there is a very quick move, but my broker closed shop on weekend, hence the gap.
We closed the signal manually for more than 200 pips because the price reached the bottom of the range. The range is not a straightforward one – it has been formed by two moving averages, the 100 smooth MA (red) at the top and the 100 simple MA (green) at the bottom. The price has been bouncing between these 2 MAs, so there is a chance that we see a bullish reversal from here. That’s why we decided to close our signal manually and pocket the pips, instead of being greedy.


