Nikkei Runs into the 100 SMA as Sentiment Continues to Improve
Nikkei has reversed higher this month but the retrace might be over soon.
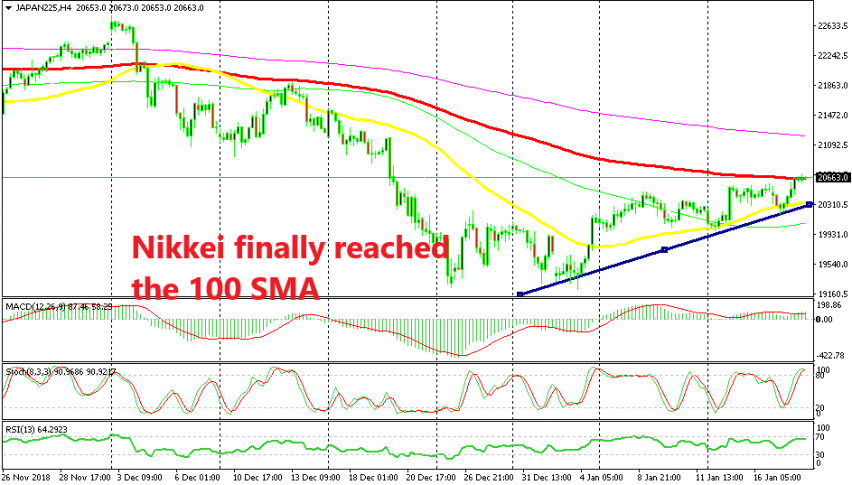
The decline that we witnessed in stock markets during last year came to a halt at the end of December and they have been climbing higher since then. In fact, they have formed a bullish trend as you can see from the H4 Nikkei chart above.
An ascending trend line has formed in Nikkei which connects the lows. That trend line has provided support on dips, but we can also count the 50 SMA (yellow) as the support indicator. This moving average has turned into support in the last two weeks.
So, a small trend has formed in Nikkei which in fact is a retrace of the bigger bearish trend. We can see that this index has formed some sort of triangle or wedge. The 100 SMA (red) is acting as the top of the triangle which the trend line and the 50 SMA are acting as the bottom axis.
The retrace higher has been unfolding in waves as trends usually do, but now the stochastic indicator is overbought so this last leg of the retrace is complete. Besides, the 100 SMA is providing resistance and the price has formed two small doji candlesticks right at this moving average, which point to a bearish reversal.
Although, the retrace higher might be complete altogether for that matter. The retrace has unfolded in waves as we mentioned and this last wave was the fifth wave, of three upwards which have been bigger and two smaller waves lower.
What kind of pattern does this remind you of?
It’s the Elliott wave pattern which consists of five waves. So, the Elliott wave pattern is complete, which suggests that the retrace higher is complete. This suggests that we should look to sell Nikkei soon, although the market sentiment is still positive today with USD/JPY running around 100 pips higher from the lows yesterday and GOLD tumbling lower after having broken the bottom of the range. So, we will wait until the sentiment starts to turn negative again, then we will probably sell this index.
- Check out our free forex signals
- Follow the top economic events on FX Leaders economic calendar
- Trade better, discover more Forex Trading Strategies
- Open a FREE Trading Account
- Read our latest reviews on: Avatrade, Exness, HFM and XM
Related Articles

Sidebar rates
Related Posts
