The 50 SMA Finally Breaks in Gold, the 100 SMA Comes Under Threat
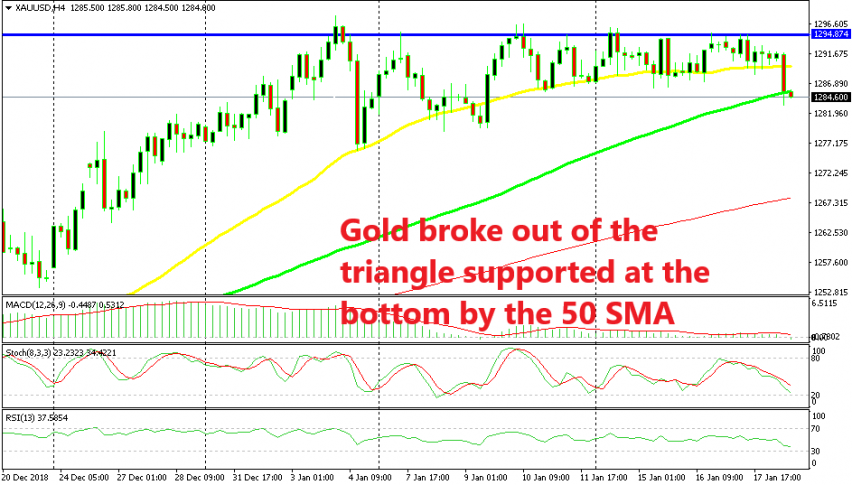
Gold finally broke the 50 SMA, but the 100 SMA is holding on on the H4 chart.

Gold has been trading inside a range in the last two weeks which has been defined by the 50 SMA (yellow) at the bottom on the H4 chart and the resistance zone around the $1,250 level on the top side. It has bounced up and down so many times during this last two weeks that it has made my head hurt, since we had a long term sell forex signal in Gold.
Although, the 50 SMA hasn’t been all on its own during this period; the 100 SMA (red) on the H1 chart has also been standing at the same level as the 50 SMA on the H4 time-frame, which has added additional strength to the support. The range has been getting narrower as moving averages climbed higher, hence moving and not static.
This has led to the formation of a triangle as we have highlighted in the last few days, or a wedge if you want to call it that way. Yesterday I said that the price was bound to explode on either side since the wedge/triangle was getting really narrow.
I hoped that it exploded to the downside and that’s exactly what it did today. The market sentiment has improved today as observed in stock markets and USD/JPY which are moving higher. Safe havens such as Gold tend to lose ground when the sentiment turns negative and the break finally happened.
The 100 SMA on the H1 chart as well as the 50 SMA on the H4 chart have now been broken and another moving average is now under threat. The price slipped below the 100 SMA (green) as you can see from the H4 chart above, but it has moved above it again in the last 15 minutes or so.
That’s why I decided to close that trade manually for around 80 pips. Now I hope/think that Gold will bounce higher to the 50 SMA which will likely turn from support to resistance. If that happens., then I will probably open another sell signal from up there. For now, we booked a pocket of pips so we’re safe.
- Check out our free forex signals
- Follow the top economic events on FX Leaders economic calendar
- Trade better, discover more Forex Trading Strategies
- Open a FREE Trading Account


