Bitcoin Sellers Try the Downside but Fail to Break the Support


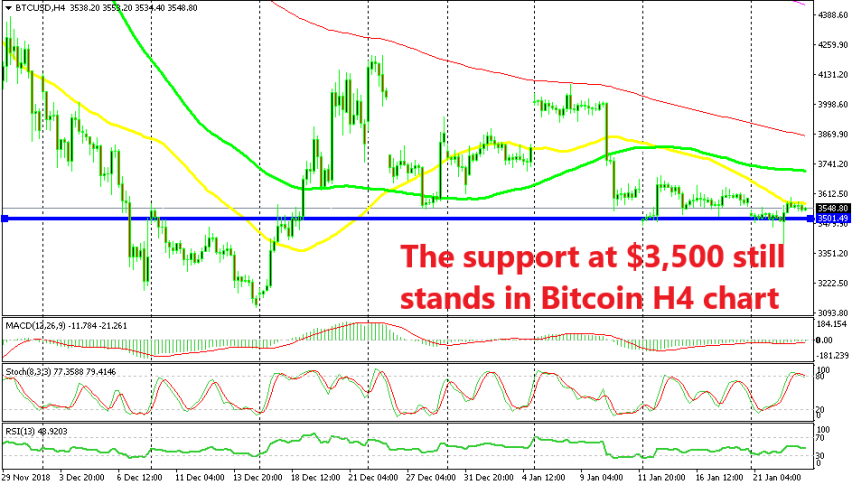
I highlighted the H4 chart in BITCOIN a few days back. This cryptocurrency made a bullish reversal after being on a bearish trend for the entire year in 2018. Although, the bullish move was capped by the 100 SMA (red) on that chart.
That moving average has been pushing the highs lower as it has provided resistance at the top side for Bitcoin during the last several weeks. On the bottom side, it was the 100 simple MA (green) which was providing support at first, but it broke about two weeks ago and we did get a pocket of pips during that move lower.
But, another support level came into play and that has been keeping sellers in check in the last two weeks. The $3,500 level which has a buffer zone around it provided resistance for Bitcoin in November and December last year and now it has turned into support.
Particularly in the last two weeks, this level has been holding the sellers at bay. Yesterday, BITCOIN sellers tried to break below the support level and pushed the price down to $3,400 in a spike lower, but the reversal was just as quick and the price returned back up. The 50 SMA (yellow) stopped the bullish reversal and it has been providing resistance sine then, so the buyers seem exhausted as well now.
But the downside is safe for now. The 50 SMA is moving lower and is seems like the price is about to move above that moving average now. If it does, the next target will be the 100 simple MA (green) which was providing support earlier.