Bitcoin Breaks Support at $3,500 as Downside Increases
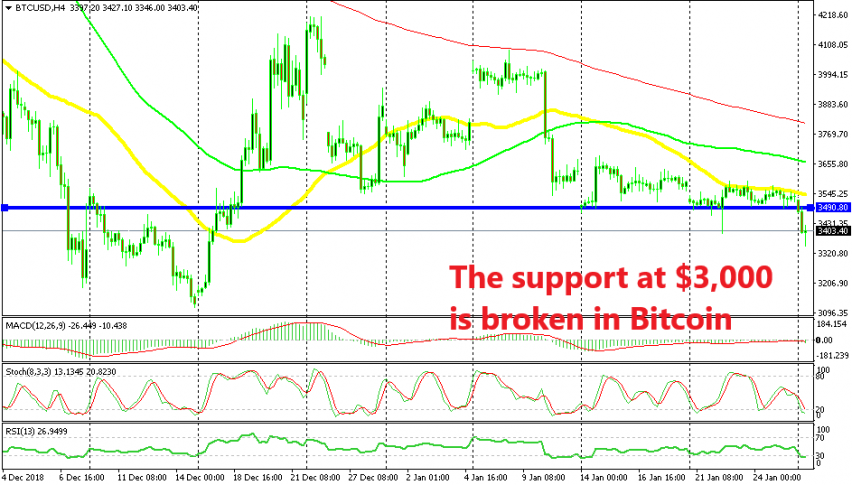
Bitcoin had been finding support at $3,500, but that level has finally been broken today.

Cryptocurrencies have lost their appeal to the general public that they had during 2016. They slipped lower last year, breaking support levels one after another but they formed a bottom at the end of last year after being on a strong bearish trend for the entire year.
BITCOIN bottomed out somewhere above the $3,000 level and bounced $1,000 higher from there in December. But, the 100 smooth MA (red) capped the bounce on the H4 chart and since then the highs have been getting lower for Bitcoin in this time-frame chart. This is a sign that the pressure still remains to the downside for Bitcoin.
Although, there was this other support level at $3,500 which had been providing support for Bitcoin in the last two weeks. With the new support at that level and with the highs falling lower, a triangle was forming on the H4 chart with the pressure to the downside of course, since all week last week the price was sticking to the support and the bounces were very minimal.
In fact, we saw a quick spike lower last week below $3,500 which was a sign that the sellers were testing the support. The buyers looked very weak as well since they couldn’t push above the 50 SMA (yellow) the entire week, so the support was bound to be broken. The highs were getting lower and the buyers were unable to respond, so here we are today, at $3,400 so the support has finally been broken.
Now the next target is the support at $3,000. We might open a sell signal but we will observe the price action for some time before making a move.
- Check out our free forex signals
- Follow the top economic events on FX Leaders economic calendar
- Trade better, discover more Forex Trading Strategies
- Open a FREE Trading Account


