Going Long on Crude Oil at the 100 SMA
Crude Oil has retraced lower overnight, but the trend is still bullish and the retrace is complete on the H1 chart, so we decided to go long
Just like stock markets, Crude Oil bottomed out at the very end of last year and it has made a bullish reversal. US WTI Crude Oil reached as low as $42.35 on my broker’s platform as the market sentiment deteriorated in the last several months of 2018, but it reversed at the end of December.
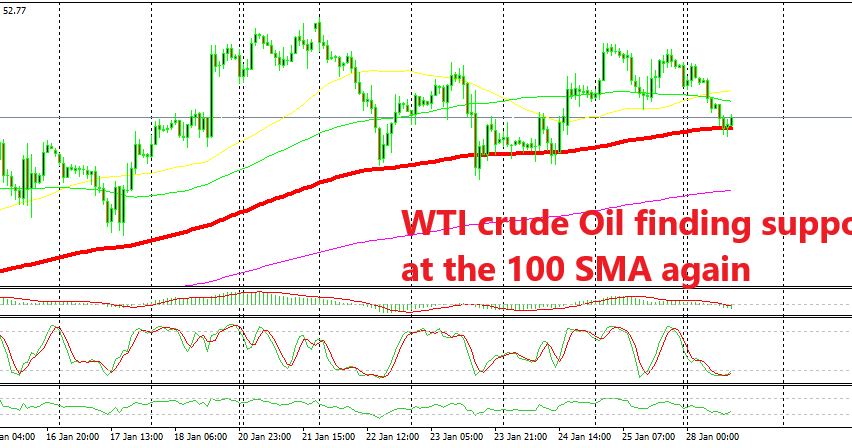
Since then, Crude Oil has climbed more than $10 higher and US WTI peaked at $54.30 last week where the climb stopped. During last week, US Oil has traded within a range. Oil seems to be on a slight downtrend in the last week or a triangle at best on the H1 chart above, but that’s just a range and the bigger trend of this month is pretty bullish.
Today, Oil has retraced more than 100 pips lower during the Asian session but it has reached the 100 SMA (red) on this time-frame chart which is providing support. This moving average used to be resistance during the way down when Oil was crashing lower, but it turned into support once the price moved above it.
The 100 SMA provided several times support last week and it seems like it is providing support again at the moment. The stochastic indicator is oversold which means that the pullback lower is complete on the H1 chart and the previous H1 candlestick formed a doji which is a bullish reversing signal after a bearish retrace.
So, the chart setup points to a bullish reversal higher and the current H1 candlestick looks already bullish, so perhaps the reversal is underway. We went long on this chart formation, now comes the waiting game.
- Check out our free forex signals
- Follow the top economic events on FX Leaders economic calendar
- Trade better, discover more Forex Trading Strategies
- Open a FREE Trading Account
- Read our latest reviews on: Avatrade, Exness, HFM and XM
Related Articles

Sidebar rates
Related Posts
